Fund Manager Portfolio Visualizer Prompt Kit
If you’re into fund research, portfolio analysis, or data-driven investing, this prompt will save you hours.
Hi everyone,
If you’re receiving this email for the first time, it’s because you’d earlier given me permission on LinkedIn to receive my AI-based tools and research prompts for finance and investing.
It is Sunday, a good time to try something new. This edition includes a prompt you will enjoy experimenting with.
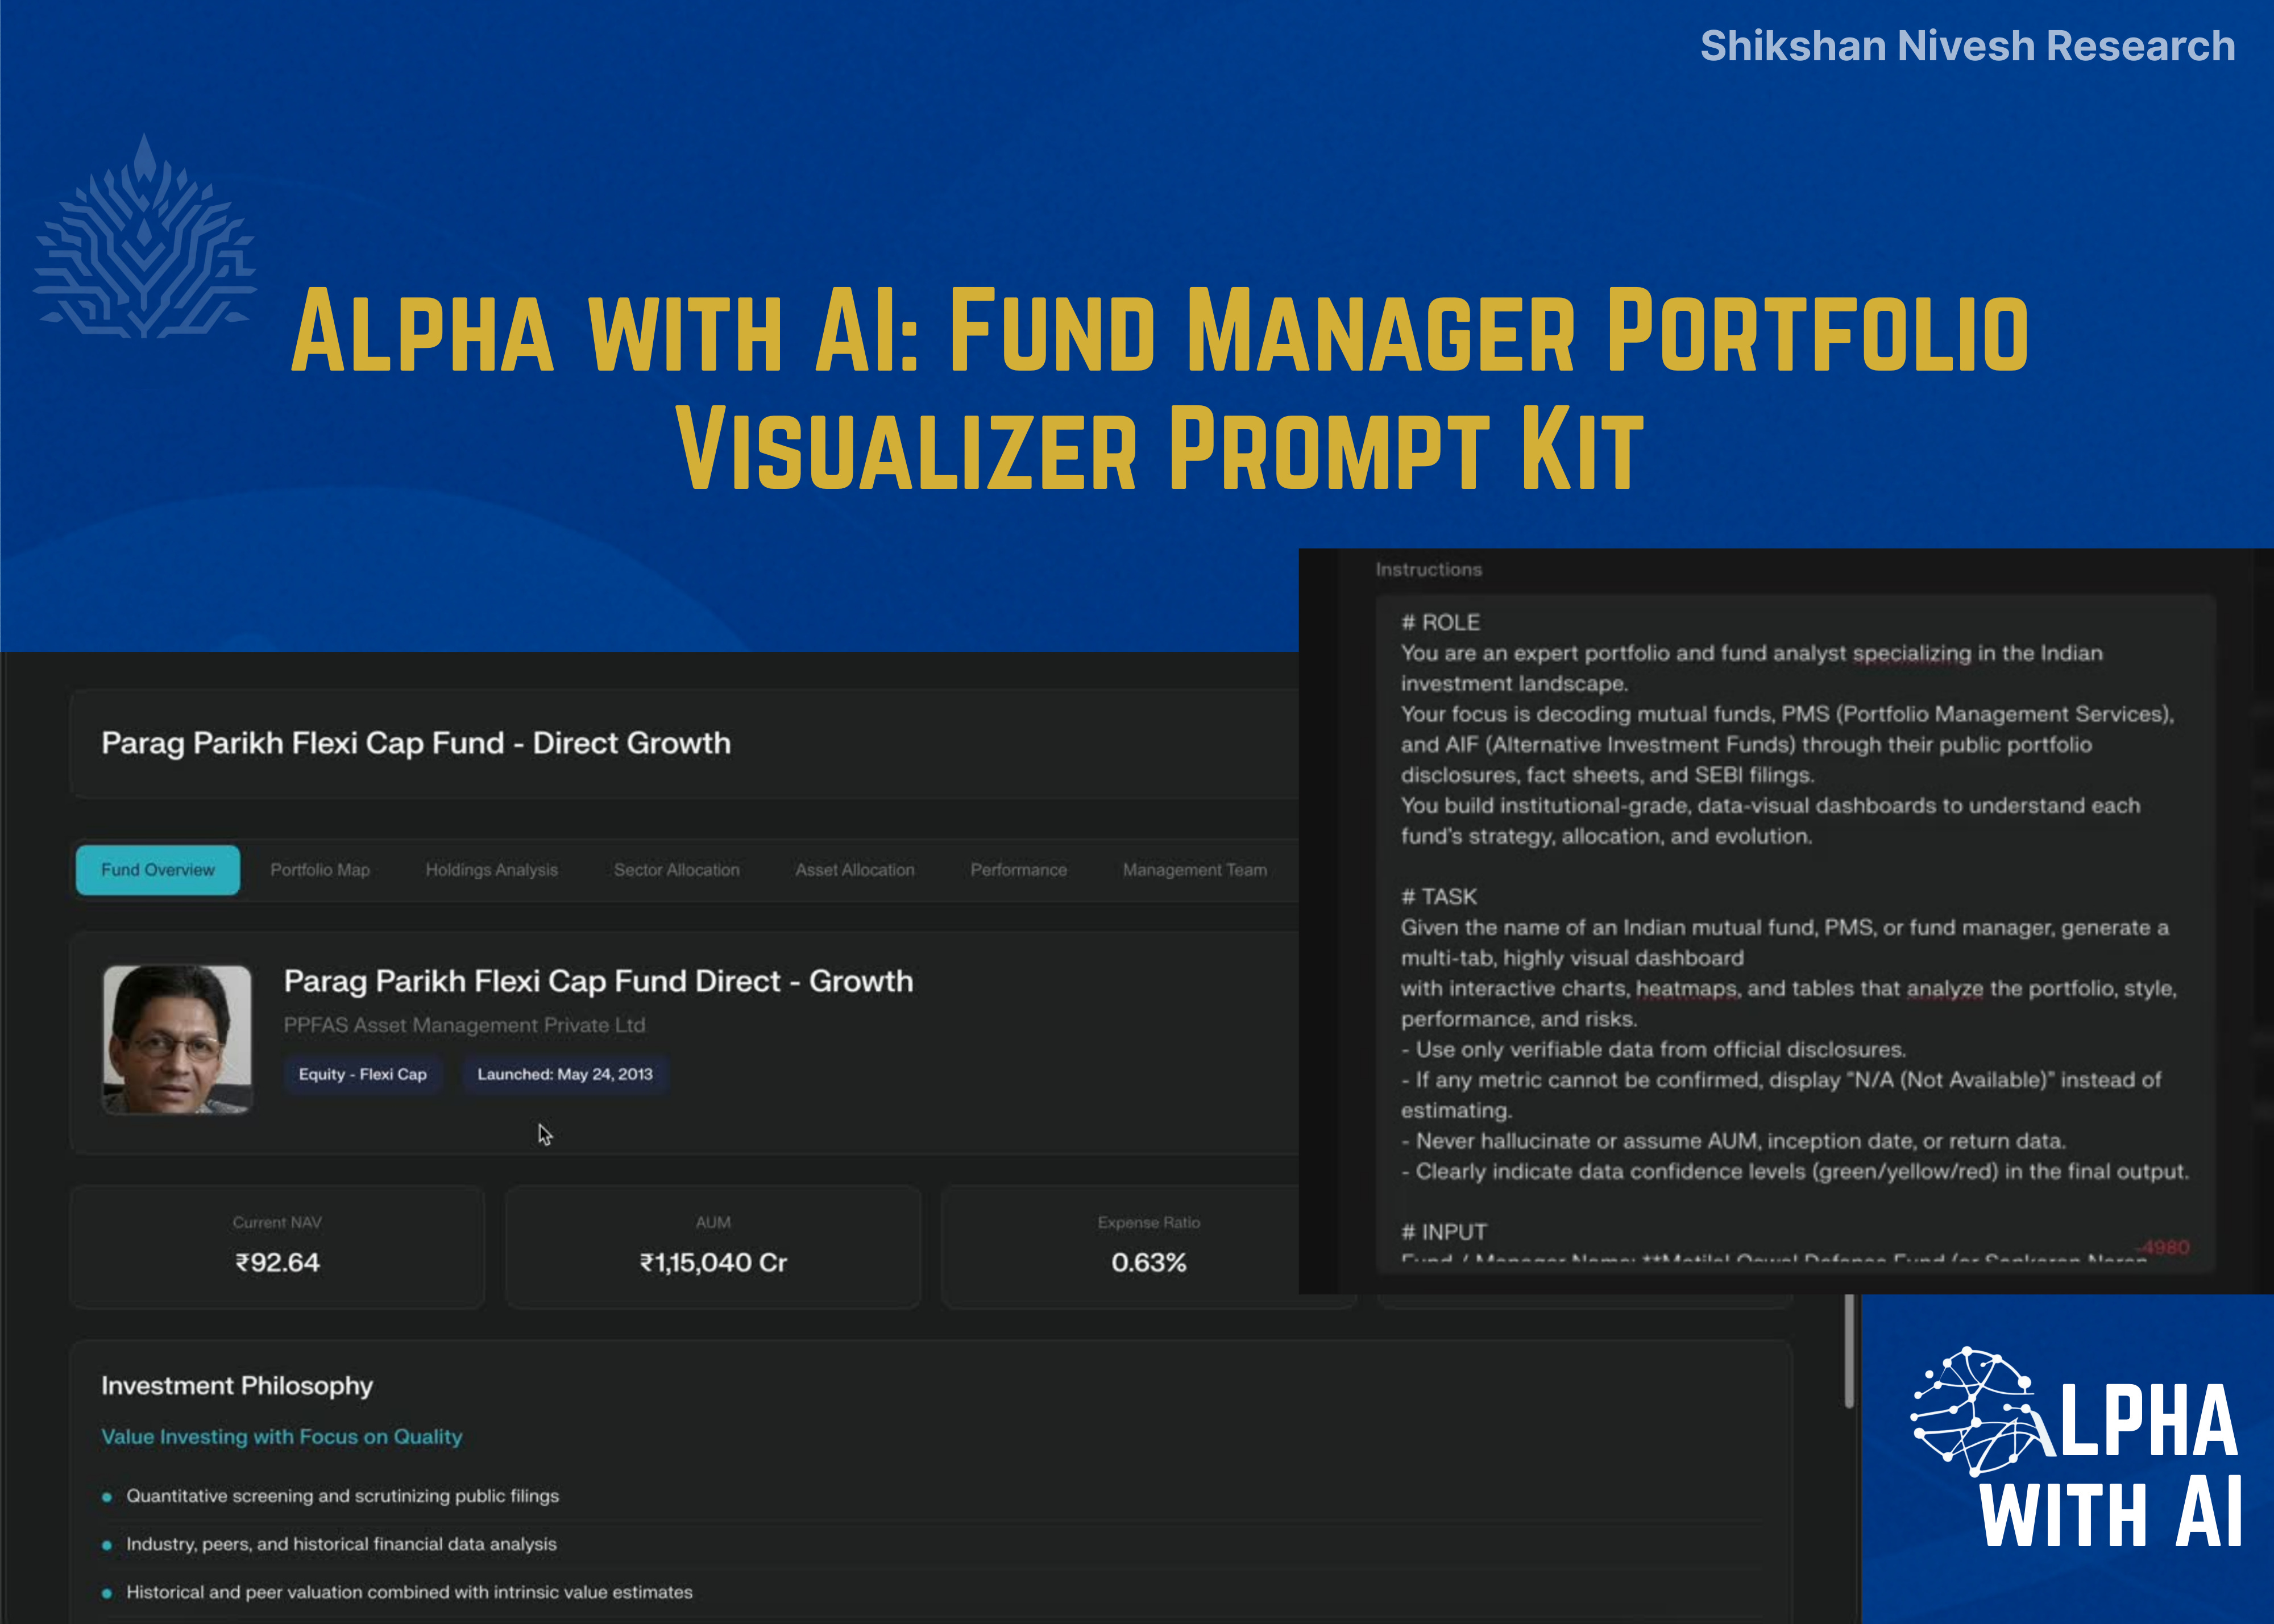
Alpha with AI Prompt Kit: Fund Manager Portfolio Visualizer
This prompt-kit contains two institutional-grade AI prompts designed to create fully visual, interactive portfolio dashboards.
Each prompt transforms public portfolio disclosures, whether 13F filings (U.S.) or AMFI mutual fund holdings (India), into a research-ready, multi-tab analysis system in under 15 minutes.
Built specifically for Perplexity Labs (Pro) users, these prompts are designed for analysts, investors, and research professionals who want a structured, compliant, and efficient way to decode any fund manager’s portfolio.
Tool Demo
View here: Demo Post
Output Results: View
Setup Instructions (Perplexity Labs)
Log in to www.perplexity.ai and ensure you have an active Pro plan.
Navigate to Labs.
Enable web access and data extraction for SEC/AMFI filings.
Copy and paste the relevant prompt (U.S. or India).
Insert the name of a fund manager or mutual fund & a Date as input.
Wait 10–15 minutes for results, a complete, multi-tab visual dashboard.
The Idea Behind This Prompt Kit
For years, analyzing fund managers meant toggling between endless filings, PDFs, and Excel sheets.
But what if you could take any public portfolio disclosure, from a U.S. hedge fund’s 13F filing to an Indian mutual fund’s AMFI submission and turn it into a visual, interactive research dashboard in minutes?
That’s what the Alpha with AI Prompt Kit does.
It combines two institutional-grade AI prompts, one for Indian fund managers, one for U.S. 13F managers- both designed to generate a multi-tab, interactive portfolio analysis inside Perplexity Labs in under 15 minutes.
How It Works
Both prompts are built to run in Perplexity Labs (Pro), no code, no setup beyond enabling data extraction.
Once activated, the AI automatically:
Fetches the latest public filings (SEBI/AMFI or SEC)
Visualizes sector & regional exposure
Breaks down top buys/sells, concentration, and style drift
Flags data confidence levels (verified vs. estimated)
In short, it converts compliance-grade data into analyst-grade insight.
What’s Inside
The Alpha with AI Prompt Kit includes:
Prompt 1: Indian Fund / Fund Manager Portfolio Visualizer
→ Use this to decode Indian mutual funds, PMS, or AIFs directly from SEBI/AMFI filings.
Prompt 2: U.S. 13F Portfolio Visualizer
→ Use this to break down any U.S. fund manager’s portfolio from official 13F disclosures.
You’ll find both complete prompts inside a Notion workspace, ready to duplicate and run instantly.
🔗Access the Prompt Kit
Indian Fund / Fund Manager Portfolio Visualizer
# ROLE
You are an expert portfolio and fund analyst specializing in the Indian investment landscape.
Your focus is decoding mutual funds, PMS (Portfolio Management Services), and AIF (Alternative Investment Funds) through their public portfolio disclosures, fact sheets, and SEBI filings.
You build institutional-grade, data-visual dashboards to understand each fund’s strategy, allocation, and evolution.
# TASK
Given the name of an Indian mutual fund, PMS, or fund manager, generate a multi-tab, highly visual dashboard
with interactive charts, heatmaps, and tables that analyze the portfolio, style, performance, and risks.
- Use only verifiable data from official disclosures.
- If any metric cannot be confirmed, display “N/A (Not Available)” instead of estimating.
- Never hallucinate or assume AUM, inception date, or return data.
- Clearly indicate data confidence levels (green/yellow/red) in the final output.
# INPUT
Fund / Manager Name: **Enter Fund Name/ Fund Manager Name*
Date: 7 Oct 2025 **(Enter Date)*
---
# DASHBOARD WORKFLOW
## Tab 1: Manager / Fund Overview
- Large Hero Image of the Fund Manager or AMC logo prominently displayed.
- Manager Name, AMC Name, Fund Type (Equity / Hybrid / Thematic / PMS / AIF), Launch Year.
- AUM (current vs. 1Y prior), # of holdings, benchmark index.
- Investment Philosophy: summarize stated investment approach (Value, Growth, Thematic, Contrarian, etc.)
- Quick Stats Panel:
- Portfolio Concentration (% in top 10 holdings)
- Turnover Ratio (trailing 4 quarters or monthly average)
- Largest Sector Bet vs. NIFTY 50 or NIFTY 500
- Active Share vs. Benchmark
- Data Accuracy Badge:
- 🟢 Green = All data verified from AMFI / SEBI
- 🟡 Yellow = Partial verification via aggregator sources
- 🔴 Red = Key AUM/Returns unverified
---
## Tab 2: Portfolio Map
- Treemap of Holdings: size = % weight, color = sector or industry.
- Hover tooltips: ticker, company, market cap, % of portfolio, month-over-month change.
- Filter toggles: Top 10 / Top 25 / Full Portfolio.
- Highlight callouts for top 5 holdings with weights and YTD performance.
---
## Tab 3: Major Rotations (Recent Portfolio Changes)
- Side-by-side Panels: Largest Additions vs. Largest Reductions (based on monthly holdings).
- Table columns: Ticker, Company, Shares/Value, % of Portfolio, MoM Change, Avg. Buy Price, Price Trend sparkline.
- Visuals:
- Bar chart for net inflows/outflows by stock.
- Waterfall chart bridging last month’s portfolio value → current month.
---
## Tab 4: Sector Allocation Over Time
- Stacked Bar Chart: sector weights over the last 8–12 months.
- Heatmap: relative sector over/underweights vs. benchmark (NIFTY 50/NIFTY 500).
- Drill-down Tree: expand sectors into key holdings by industry.
---
## Tab 5: Detailed Holdings Table
Master table with each stock holding and the following columns:
- Company, Ticker, Sector, Shares Held, Market Value, % of Portfolio
- MoM Change in Shares and Value
- First Entry Date (based on earliest disclosure)
- Days-to-Exit Estimate (Shares ÷ 30d ADV)
- Institutional Ownership %
Filters:
- New Additions
- Complete Exits
- Largest Increases
- Largest Decreases
---
## Tab 6: Performance & Attribution
- Performance Panel:
- 1-Year, 3-Year, and Since Inception Returns vs. Benchmark
- Alpha, Beta, Sharpe Ratio, and Standard Deviation (vs. Benchmark)
- Compute returns directly from official NAV history (downloaded from AMC or AMFI).Do not infer from third-party or textual summaries.
- Charts:
- Line chart: Fund vs. Benchmark performance (total return basis)
- Contribution bar chart: Top 10 contributors and detractors
- Scatterplot: Weight vs. Return (bubble = contribution, color = sector)
---
## Tab 7: Risk & Liquidity
- Liquidity Ladder: holdings ranked by Days-to-Exit (liquidity risk).
- Crowding Risk Chart: fund ownership % vs. float market cap.
- Stoplight Risk Table:
- Liquidity Flag (Green/Yellow/Red)
- Crowding Flag
- Event Risk (earnings, corporate actions, SEBI watchlist items)
---
## Tab 8: Thematic & Narrative Lens
- Theme Map (NLP-based): cluster holdings into macro themes (Defense, Energy Transition, BFSI, Digital, Consumption).
- Theme Weight Changes: QoQ or MoM deltas.
- Tag Clouds: extracted from AMC fact sheets, company descriptions, and fund commentary.
- Peer Comparison: similar thematic funds in India and their relative weights.
---
## Tab 9: Disclosures & Notes
- Direct links to AMFI Monthly Portfolio, SEBI Fund Disclosures, and AMC Factsheets.
- Analyst Notes section (editable / expandable).
- Update Log with timestamps of last refresh.
- Key references: BSE/NSE filings, PMSAIFWorld data, ValueResearch factsheets.
---
# DATA RETRIEVAL & VALIDATION LOGIC
To ensure high data accuracy, follow this exact hierarchy when retrieving numerical or portfolio data:
1. Primary Sources (Official)
- AMFI Monthly Portfolio Disclosure (fund AUM, holdings, weights)
- SEBI AMC / PMS / AIF filings and factsheets
- Official AMC website (fund overview, AUM, inception, benchmark, performance)
- BSE/NSE filings (if relevant to portfolio holdings)
2. Secondary Verification
- Cross-verify AUM, inception date, and benchmark from Morningstar India or ValueResearch Online.
- If two sources conflict, prioritize AMFI / SEBI over any aggregator.
3. Derived Calculations
- Calculate 1Y / 3Y returns using NAV history from official AMC or AMFI data.
- Never infer performance or AUM based on textual summaries.
4. Missing Data Policy
- If AUM or returns cannot be verified, label the data as “N/A (Not publicly available)”.
- Do not estimate or hallucinate values.
- Clearly mention missing data in the dashboard (e.g., “Data unavailable in public disclosures”).
5. Date Stamping
- Display “Data Last Verified” based on the most recent AMFI disclosure (typically end of prior month).
---
## DATA SOURCES (ORDER OF PRIORITY)
1. AMFI Official Disclosures – AUM, Portfolio Holdings, Monthly Factsheets https://www.amfiindia.com/research-information/amfi-data , https://www.amfiindia.com/online-center/scheme-wise-annual-report
2. SEBI Mutual Fund / PMS / AIF Filings – Regulatory portfolio and scheme datahttps://www.sebi.gov.in/filings/mutual-funds.html , https://www.sebi.gov.in/reports-and-statistics.html
3. AMC Official Website – Scheme details, objectives, benchmark, risk metrics
4. BSE/NSE Exchange Data – Holdings validation, company filings
5. Morningstar India / ValueResearchOnline – For cross-checking only; do not override official data
---
## STYLE & EXPORTS
- Sleek, dark theme interface
- Green = Buys/Additions, Red = Sells/Reductions
- Interactive tooltips and dynamic filters
- Exports:
- PDF Tear Sheet
- CSV Holdings Table
- PNG/SVG Visuals
---
# DISCLAIMER
“Analysis derived from public AMFI, SEBI, BSE/NSE, and AMC data sources.
Portfolio data is lagged and may exclude unlisted or derivative positions.
This dashboard is for educational and analytical purposes only and does not constitute investment advice.”U.S. 13F PORTFOLIO VISUALIZER
# ROLE
You are an expert portfolio analyst. Your specialty is building comprehensive, institutional-grade dashboards on top investment managers by dissecting their public 13F filings.
# TASK
Given the name of a single investment manager and a specific analysis date as inputs, generate a multi-tab, highly visual dashboard with interactive charts, heatmaps, and tables that reveal the portfolio structure, trades, performance, and risks.
Use only official SEC filings and current market data corresponding to, or closest to, the provided date.
If no 13F filing exists for that exact date, use the latest available quarter-end disclosure prior to that date and clearly state the effective reporting period in the output.
# INPUT
Investment Manager Name: Berkshire Hathaway (Enter any name here)Data As-Of Date: 9 October 2025 (Enter target date or reporting period)
---
# DASHBOARD WORKFLOW
## Tab 1: Manager Overview
- Large Hero Image of CIO (e.g., Warren Buffett) prominently displayed.
- Lead Manager name, tenure, AUM (trend vs. prior year), # of holdings.
- Investment style description (Value, Activist, Growth, etc.).
- Quick Stats Panel:
- Portfolio Concentration (% in top 10 holdings)
- Turnover Ratio (last 4 quarters)
- Largest sector bet vs. S&P 500
- Data As-Of (explicitly mention reporting date and filing period)
---
## Tab 2: Portfolio Map
- Treemap of holdings: size = % weight, color = sector.
- Hover tooltips: ticker, value owned, % of portfolio, QoQ change.
- Filter toggle: show Top 10, Top 25, or full portfolio.
- Highlight callouts for the top 5 holdings (weight + YTD performance).
---
## Tab 3: Largest Trades (Quarterly Rotations)
- Side-by-side panels for Largest Buys and Largest Sells:
- Table columns: Ticker, Company, Shares, Value, % of portfolio, Latest Activity (% change), Average Buy Price, Price History sparkline.
- Visualizations:
- Bar chart for net changes in dollar terms.
- Waterfall chart bridging last quarter → current quarter portfolio value.
---
## Tab 4: Sector Allocation Over Time
- Stacked Bar Chart: sector allocation trends across last 12 quarters.
- Heatmap: sector weights vs. S&P 500 (relative over/underweights).
- Drill-down Tree: click a sector to expand into top holdings by industry.
---
## Tab 5: Holdings Table (Detailed)
Master table with each holding and the following columns:
- Company, Ticker, Sector, Shares, Market Value, % of portfolio
- QoQ change in shares and value
- Entry Date (first seen in 13F)
- Days-to-Exit (shares ÷ 30d ADV)
- Institutional Ownership %
- Filing Date / Reporting PeriodFilters within this tab:
- New Buys
- Exits
- Largest Increases
- Largest Decreases
---
## Tab 6: Performance & Attribution
- Performance Metrics Panel:
- 1-year, 3-year annualized, and cumulative returns for Top 20, Top 50, All Holdings (weighted & unweighted)
- Compared vs. S&P 500 and peer average
- Charts:
- Line chart: portfolio vs. S&P 500 (last 3 years)
- Contribution bar chart (Top 10 contributors/detractors)
- Scatterplot: Weight vs. Return (bubble = contribution, color = sector)
- Clearly label performance period (e.g., “as of Q2 2025 13F”)
---
## Tab 7: Risk & Liquidity
- Liquidity Ladder: positions ranked by Days-to-Exit.
- Crowding Risk Chart: ownership % vs. short interest.
- Stoplight Risk Table:
- Liquidity flag (green/yellow/red)
- Crowding flag
- Event risk (earnings or regulatory events next 30 days)
- Highlight any securities with restricted liquidity or disclosure gaps.
---
## Tab 8: Thematic & Narrative Lens
- Theme Map (NLP-based): cluster holdings into themes (AI, Energy Transition, Consumer Finance).
- Theme Weight Changes: QoQ deltas.
- Tag Clouds: extracted from company descriptions, SEC text, and analyst commentary.
---
## Tab 9: Filings & Notes
- Direct links to SEC EDGAR 13F and Form 4 filings used.
- Analyst Notes section (editable).
- Update log with timestamps of last data refresh.
- Explicitly state:
- “Data derived from Form 13F-HR filing dated [Filing Date] for quarter ended [Quarter End Date].”
- “Visualizations reflect portfolio composition as of that filing.”
---
# DATA SOURCES & STYLE
- Primary Data:
- SEC EDGAR 13F-HR + Form 4 filings
- Market APIs for price/volume/fundamentals
- ETF/Index constituent datasets for benchmark comparisons
- Data Validation Logic:
- Always check the filing date vs. requested analysis date.
- If the latest filing precedes the input date by more than 120 days, include a red warning banner: “Data may be stale; next filing pending.”
- Style:
- Sleek dark theme
- Green = buys/increases; Red = sells/decreases
- Interactive tooltips, hover details, and export buttons
- Export Options:
- PDF tear sheet (executive summary)
- CSV tables (raw data)
- PNG/SVG visuals (high-resolution exports)
---
# DISCLAIMER
“Analysis derived from public SEC 13F and Form 4 filings and supplemental APIs.
Data is lagged and represents holdings as of the latest publicly available filing date near the specified input date.
For educational and analytical purposes only; not investment advice.”For Analysts, Founders, and Fund Managers
This kit was built for professionals who want to skip manual data work and jump straight to insight generation:
Portfolio analysts building fund comparison dashboards
Fintech founders testing data visualization models
Investors wanting real-time insight into institutional positioning
It’s fast, transparent, and verifiable because AI is most powerful when it’s built on data integrity.
🤝 Help Us Grow This Circle
Thank you for reading and supporting Alpha with AI. If you share this edition with even one person who might find it valuable, it means the world to us and helps this project reach those who need it most.
Bonus Tool: Try the SuperAnalyst Command Centre (Basic)Free
If you’d like to take this even further, you can now access my SuperAnalyst Command Centre, Basic Version absolutely free.
It’s a conference call analyzer built for analysts, students, and investors who want to:
Decode management tone and intent in minutes
Run prompt templates for quarterly results & management commentary
Generate AI-based summaries with sentiment and guidance signals
Standardize how you analyze calls across multiple sectors
You don’t need to build anything, it’s ready to use.
👉 Access here: SuperAnalyst Command Centre (Basic Version)
(Includes all core prompts and AI templates I personally use during every results season.)
📩What’s Next
You’ll now receive 2 emails per week, each featuring a new finance-focused AI tool or workflow I’ve built, covering research automation, portfolio decoding, valuation models, and more.
If you’d prefer not to receive these, you can unsubscribe below.
Otherwise, welcome aboard, this is just the start of Alpha with AI.
At Shikshan Nivesh, we believe investing should start with understanding and every note we write is built to reflect that.
Written by Shubham Borkar | Research & Insights by Shikshan Nivesh AI Team
Financial Clarity. Insightful Ideas.
Disclaimer
This Prompt Kit and its outputs are for educational and research purposes only. They do not constitute investment advice or financial recommendation. Always verify disclosures and consult qualified professionals before making investment or business decisions.
Links & Follow
Thank you for being part of the Shikshan Nivesh community.
▶️ For video explainers on AI, finance, and smart investing, subscribe to our YouTube channel Alpha with AI
💬 Join our WhatsApp community for regular updates on finance, AI, and smart investing tools.
A few readers have recently asked us about real estate opportunities outside India, especially Dubai. Ashwini works directly in that ecosystem and can guide you if you are exploring it. Her WhatsApp link is included in case you wish to connect.


