

Grok 4.1 Global Equity Research and Earnings Intelligence Edition
Learn how Grok 4.1 builds global equity research reports and converts earnings calls into dashboards with two powerful prompts for analysts and investors.

Hi everyone,
This edition introduces two of the strongest global workflows we have built so far using Grok 4.1.
Both are universal.
Both work for India, US, Europe, APAC or any listed company.
Both are designed for analysts, PMs, advisors, students and anyone who relies on deep fundamental analysis.
What is inside this newsletter
You will receive:
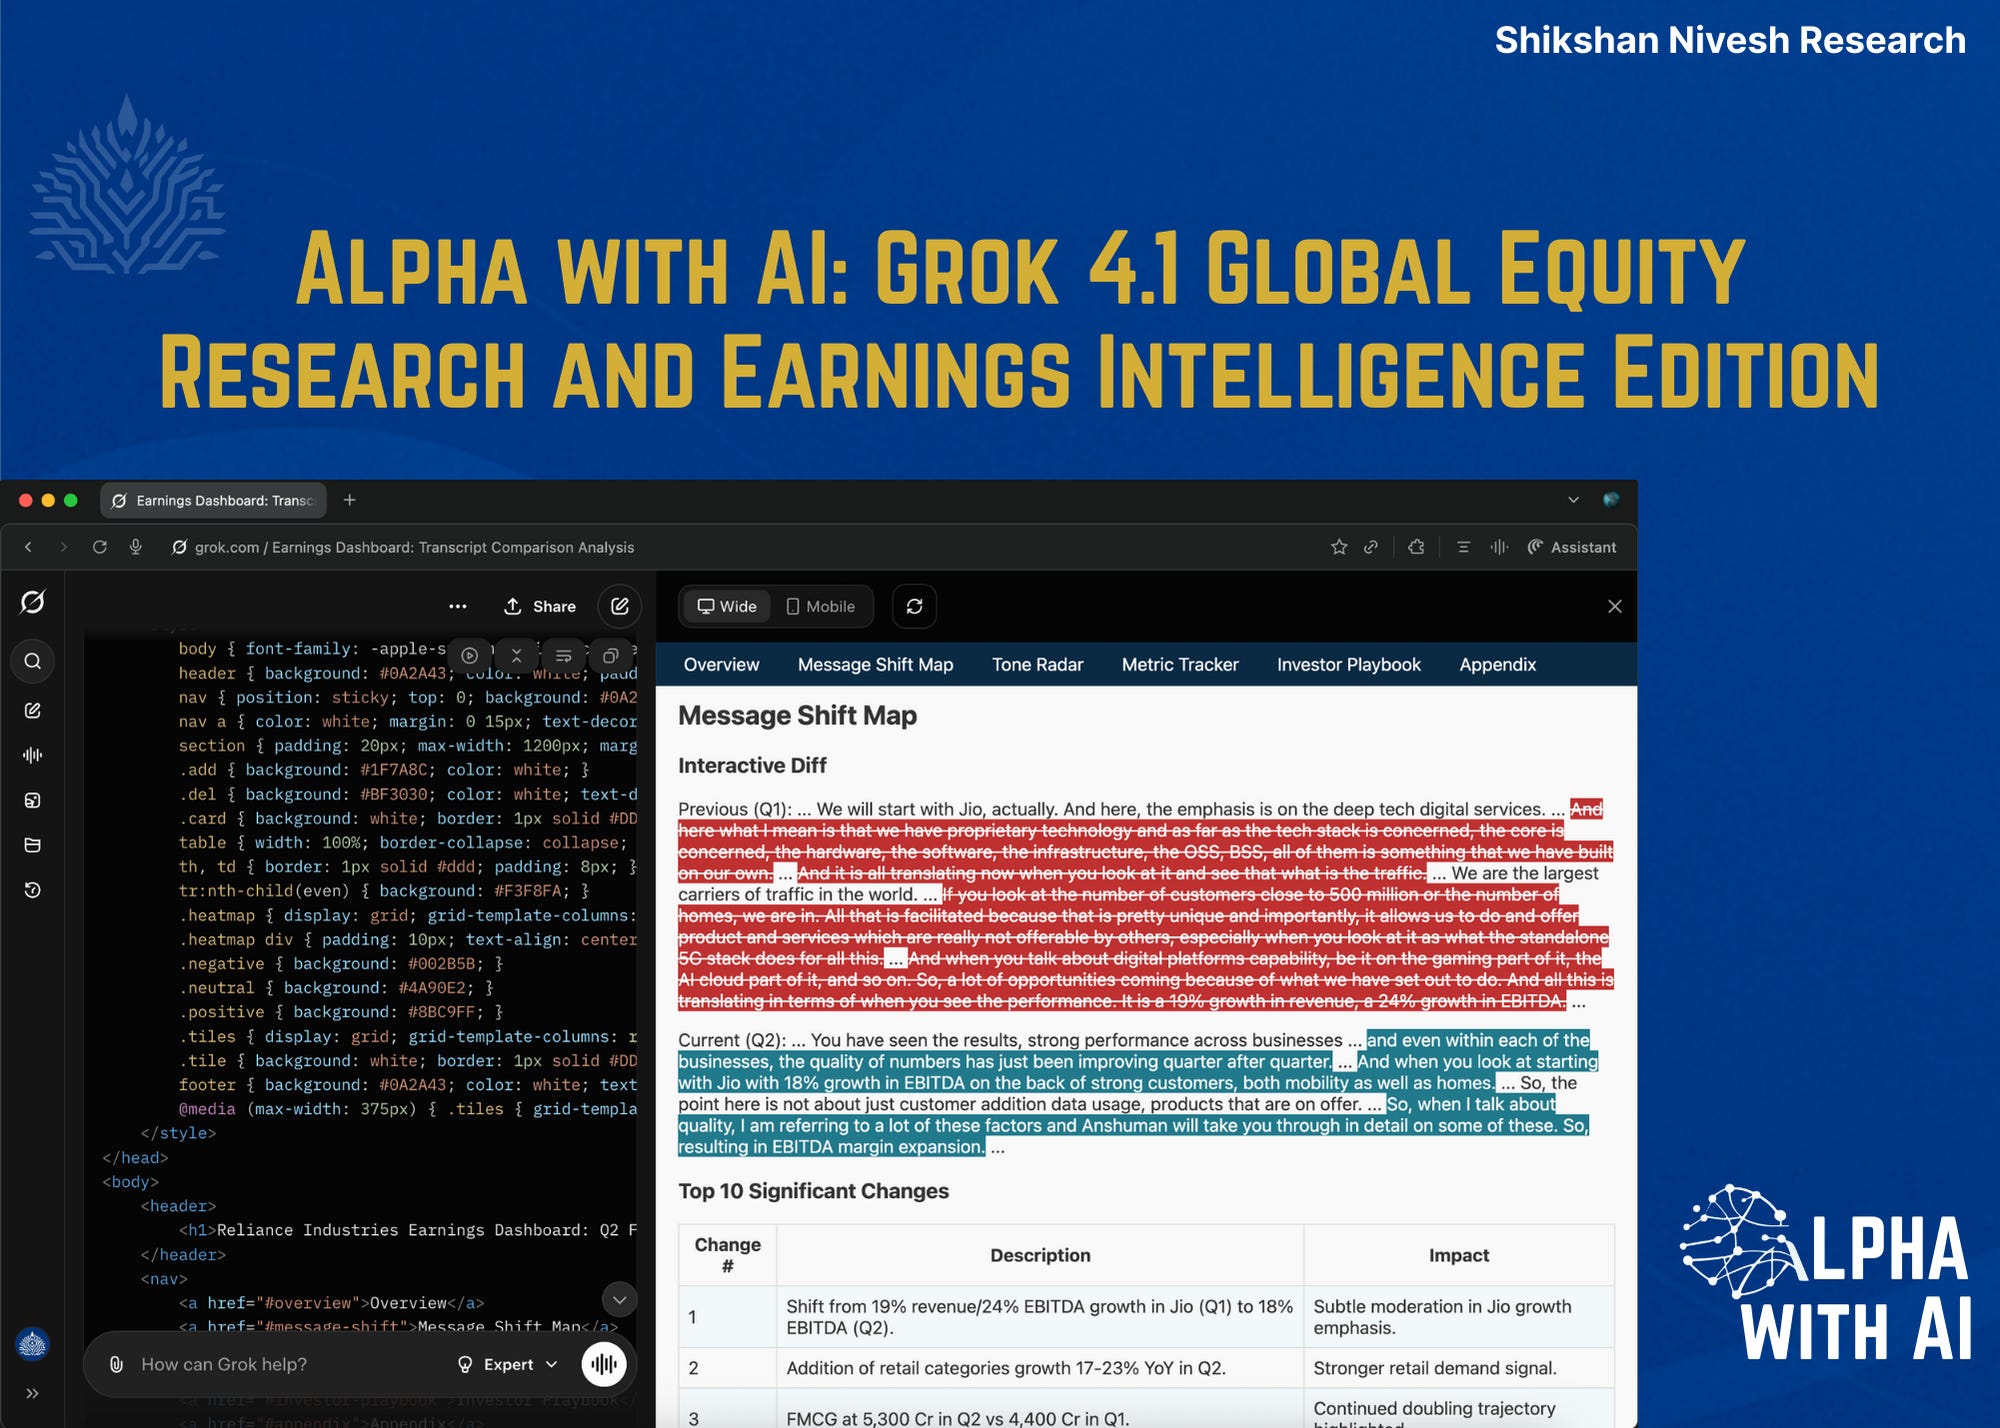
Global Equity Research Coverage Prompt
Global Earnings Call Tone Shift Dashboard Prompt
Reference post and output from our Krsnaa Diagnostics test
Interpretation guidelines for both workflows
Market use cases
Access instructions
This edition is focused on one idea:
AI can now support end to end research workflows at a level that analysts can actually use.
1. Global Equity Research Coverage Prompt
A full scale research prompt that produces a complete, structured coverage style report for any global company.


Built for both emerging markets and developed markets.
The prompt covers:
Key data snapshot
Thesis
Drivers
Operating assumptions
Peer comparison
Valuation
Risks
Cl…
