IPO Financial & Strategic Dashboard
Decode IPOs with AI
Hi everyone,
If you’re receiving this email for the first time, it’s because you’d earlier given me permission on LinkedIn to receive my AI-based research tools and long-form prompts for finance and investing.
What’s Inside This Newsletter
You’ll receive:
DRHP-Based IPO Dashboard Prompt
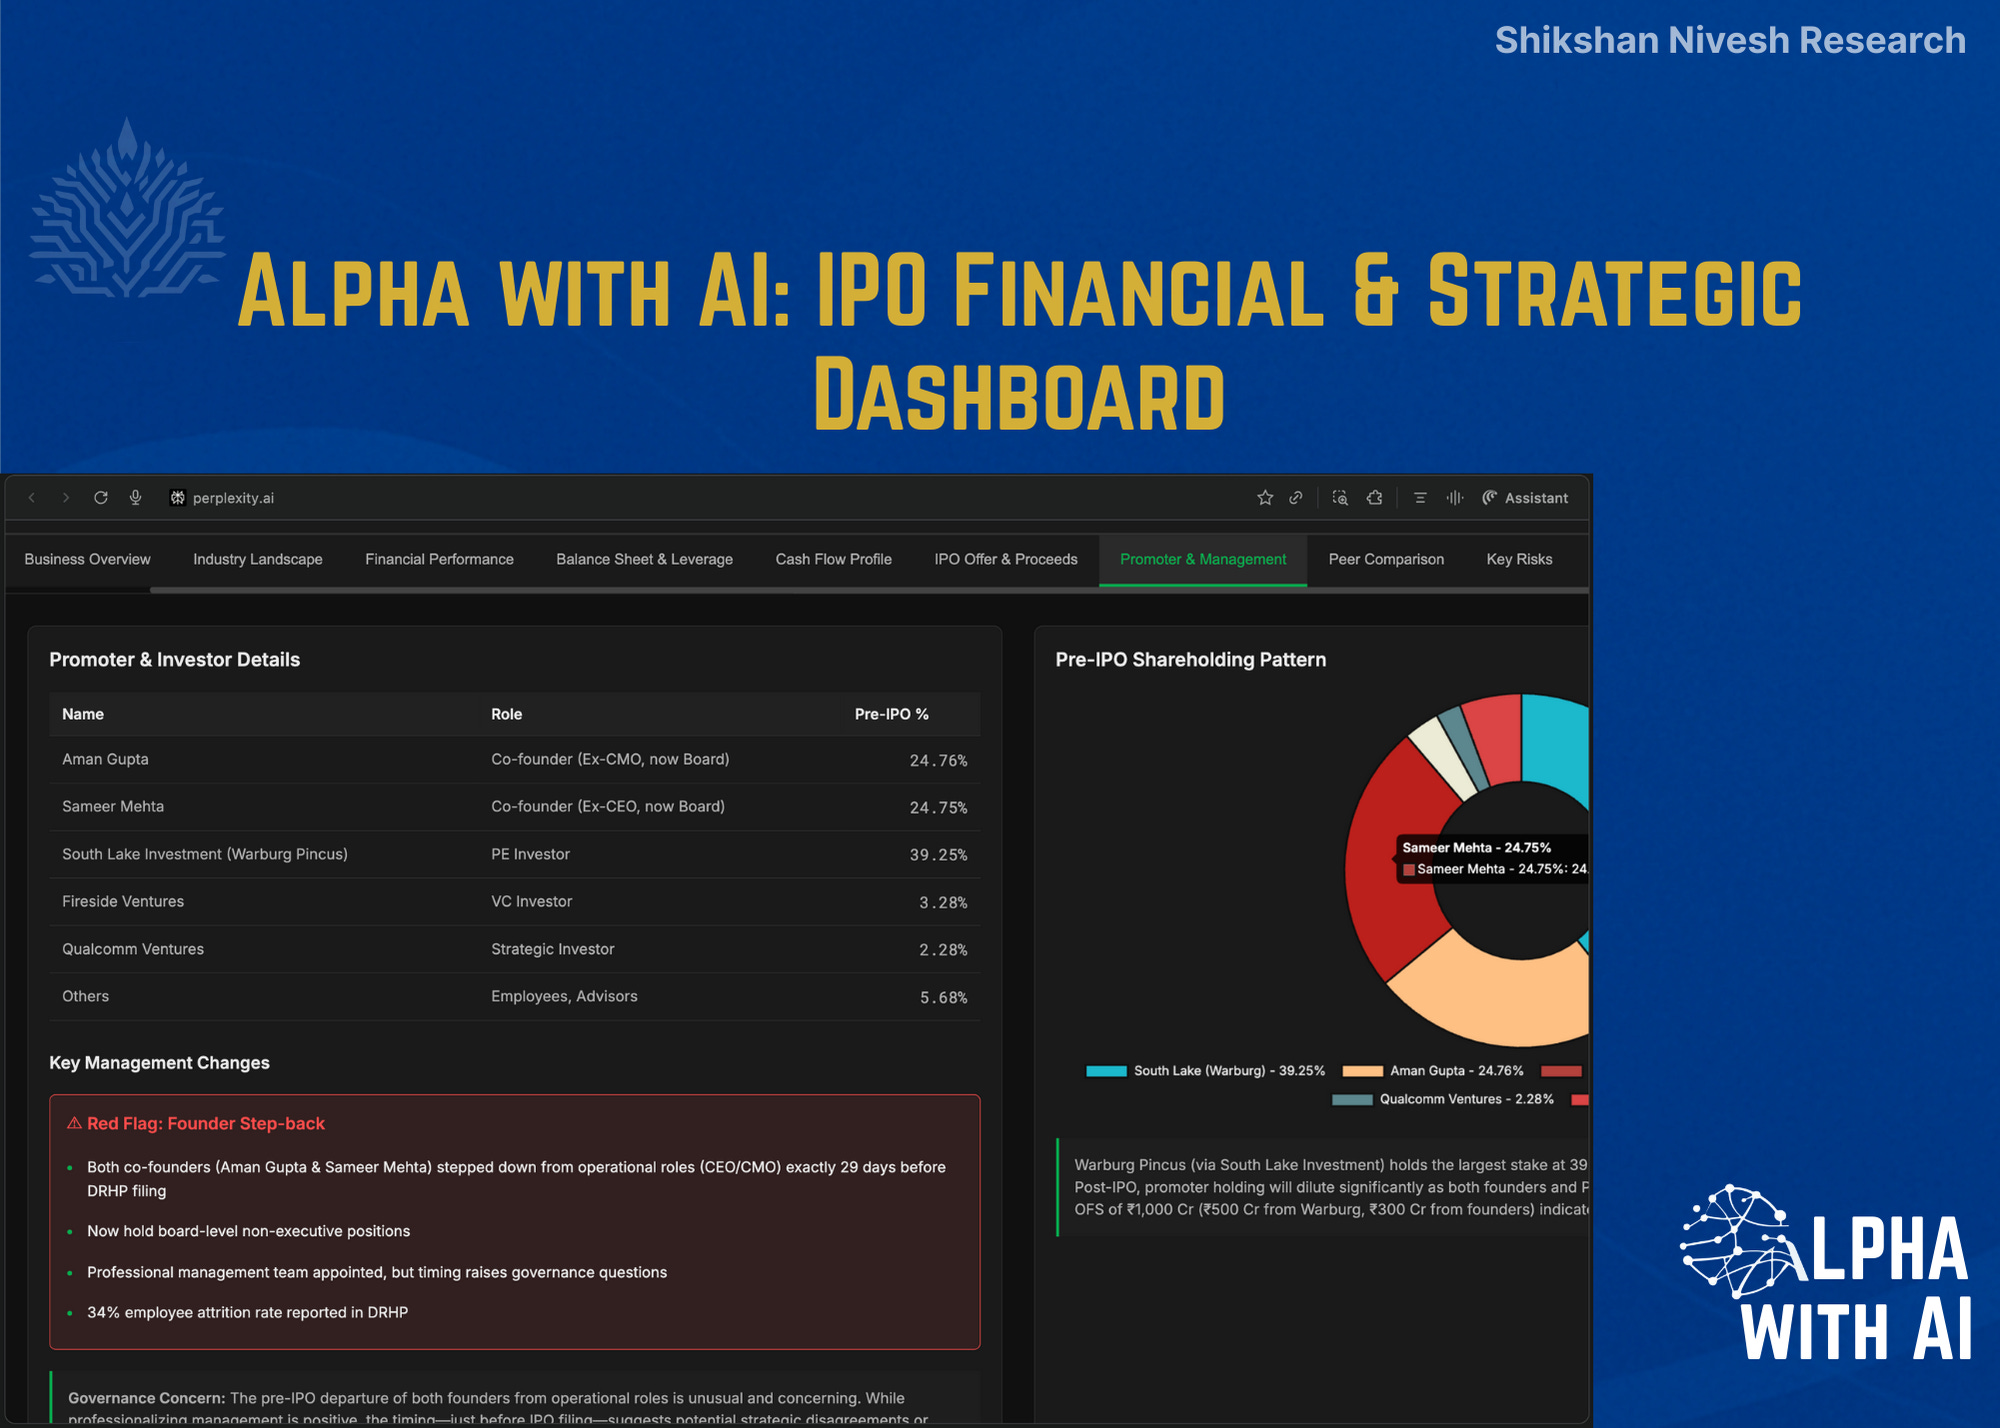
Reference Post: full walkthrough of the boAt IPO analysis
Interpretation Notes: how to read DRHP anomalies and red-flags
Example Dashboard Output(boAt IPO)
How to instantly visualise any IPO with AI
Decode IPOs with AI
Using AI to read DRHPs, highlight red flags, and generate institutional-style IPO dashboards
This week’s Alpha with AI edition is built around one simple idea:
Most investors never read the DRHP properly.
Every Indian IPO starts with a Draft Red Herring Prospectus.
It contains 300–500 pages of details on promoters, financials, risks, related-party transactions, valuation logic, and disclosures.
But nobody has the time to read all of it.
So we built an AI toolkit that does it for you.
The DRHP-Based IPO Dashboard reads the entire prospectus, highlights the red flags, extracts all financial tables, maps promoter history, scans key risks, and gives you a complete visual dashboard in under ten minutes.
This tool works for any Indian IPO simply by entering the company name.
Inside the toolkit, you’ll get:
A full DRHP Visual Dashboard Prompt
A complete analysis flow used by analysts
A structured IPO mapping framework
A real example: boAt (Imagine Marketing Ltd) DRHP analysis
DRHP-Based IPO Dashboard Prompt
This AI prompt reads a company’s entire DRHP and converts it into a structured 12-tab Bloomberg-style dashboard.
It covers:
Executive Summary
Business Overview
Industry Landscape
Financials
Balance Sheet and Leverage
Cash Flow Profile
Promoter and Management
Peer Comparison
Valuation Map
Key Risks and Red Flags
Analyst Notes
Overall Assessment
Everything is derived from the company’s own filings.
Tool Demo
Still reading DRHPs manually?
AI can now decode an entire IPO prospectus in minutes.
This week we tested it on boAt (Imagine Marketing Ltd), one of India’s most watched upcoming IPOs.
The dashboard instantly surfaced red-flags most investors would miss:
Both co-founders stepped down 29 days before the DRHP filing
Attrition rate disclosed at 34 percent
Revenue CAGR (FY23–FY25) at negative 4.6 percent
FY24 PAT at minus 80 crore, suddenly flipping to plus 61 crore in FY25
Revenue stagnation and wearables collapse under key risk disclosures
All of this was automatically extracted and highlighted by the dashboard.
You’ll find the reference post inside this edition.
⚙️ Setup Instructions (Perplexity Labs)
Log in to www.perplexity.ai
and ensure you have an active Pro plan.
Navigate to Labs from the left sidebar.
Enable Web Access and Data Extraction for SEC filings (for global).
Copy and paste the relevant prompt from this article (Indian or Global version).
Insert the IPO company name and ticker as input (e.g., boAt).
Wait 10–15 minutes for results, the AI will automatically build a Multiple-tab visual dashboard with tables, charts, and commentary.
That’s it.
You’ll have an institutional-grade IPO dashboard ready, directly inside your browser.
If You’re Not a Perplexity Pro User
For users outside India:
You can subscribe to Perplexity Pro directly at $240/year from perplexity.ai/pro
For users in India:
Airtel users get 1 year of Perplexity Pro completely free, thanks to a partnership between Airtel and Perplexity.
Simply apply through your Airtel Thanks app or Airtel staff support to activate the benefit.
Alternatively, if you prefer to subscribe directly —
you can get 1 month of Perplexity Pro free through my Comet Browser referral link — https://pplx.ai/shubhamsbo10661
Just log in via Comet Browser, and you’ll automatically receive one month of Pro access for testing the prompt suite.
Why This Tool Matters
The DRHP is the truth document.
Every line inside it is legally binding.
But hidden across hundreds of pages, the most important signals get buried:
Sudden promoter exits
Accounting anomalies
Related-party dependencies
Segment-level collapses
Debt repayment strategies
Margin manipulation
Key customer concentration
Financial swings before listing
AI brings all those signals to the surface instantly.
The goal of this tool is not to replace judgment, but to speed up clarity.
A process that usually takes analysts 2–3 days can now be compressed to ten minutes.
How It Works
Reads the company’s DRHP via Perplexity.
Extracts all financials, management disclosures, and risk sections.
Breaks them into structured tabs.
Highlights inconsistencies and pattern shifts.
Builds a complete dashboard ready for analysis.
No manual reading required.
No downloading PDFs.
No searching for data.
Just structured interpretation.
Example Dashboard Output
You’ll find the complete boAt dashboard inside this edition.
It includes:
Revenue, EBITDA, PAT trends
Leverage profile
Promoter exits
Segment-level trends
Valuation comparison
Key risks
Industry view
Post-IPO shareholding
Everything is automatically generated from the DRHP.
Click to View: Dashboard Output
How to Read DRHP Data
The dashboard highlights signals across four blocks:
Promoter and Management
Look for exits, ownership drops, sudden structural changes.
Financial Pattern Shifts
Negative CAGRs, sudden profitability improvements, margin reversals.
Concentration and Dependencies
Customer, geography, vendor, segment reliance.
Key Risks
Read the risk section carefully. It often reveals what management will never say publicly.
Quick rule:
If promoter behavior and financial trend diverge, look deeper.
Who It’s For
Anyone who analyses IPOs:
Equity analysts
Investment advisors
PMs
Traders
Students preparing for research roles
Founders studying market signals
Retail investors who want more than social-media opinions
Framework Used
DRHP Forensic Framework
Reads promoter history
Identifies financial shifts
Maps segment-level weakness
Extracts legal and regulatory disclosures
Highlights operational anomalies
Compares peer valuation
Scores disclosure clarity
This is typically how institutional analysts read a DRHP, now automated.
Access the Toolkit
Simply copy the prompt, paste it into your Perplexity Labs workspace, enter the IPO name, and run it.
Execution time: 8–10 minutes for a complete IPO dashboard.
Prompt
🖥️ **INTERACTIVE DASHBOARD PROMPT — DRHP-BASED IPO ANALYSIS (INDIA EDITION)**
© Shikshan Nivesh Research | All Rights Reserved
---
### ASSET TYPE
Create an **interactive Bloomberg-style dashboard** (not a static report).
Output should render as a **multi-tab analytical interface**, not plain text.
Each tab must include:
- Interactive tables
- Dynamic charts (1600 × 1000 px, 300 DPI)
- Concise factual commentary blocks
- Dark Bloomberg theme with green (positive) and red (negative) highlights
---
### ASSET NAME
“IPO Financial & Strategic Dashboard — <Company Name> ( DRHP Based )”
**Credit:** Research & Insights by Shikshan Nivesh Research
---
### TAB STRUCTURE
Create **12 interactive tabs** in the sequence below.
Each tab = data table + commentary + chart panel.
---
#### 🟩 TAB 1 — Executive Summary
• Overview of <Company Name>’s business model, IPO rationale & market opportunity.
• Show issue size (₹ crore), Fresh Issue vs OFS split.
• Highlight strengths and investor concerns.
• Chart 1 — IPO Structure (Fresh Issue vs OFS).
• Footer Credit: Source – Company DRHP | Credit – Shikshan Nivesh Research
---
#### 🟩 TAB 2 — Business Overview
• Table: Key business segments and revenue % (FY23–FY25).
• Explain products, geographies, customers.
• Chart 2 — Business Model / Value Chain Map.
• Footer Credit: Source – Company DRHP | Credit – Shikshan Nivesh Research
---
#### 🟩 TAB 3 — Industry Landscape
• Table: Industry size (₹ crore), CAGR, key competitors, market share.
• Comment on demand drivers & regulations.
• Chart 3 — Industry Growth vs Company CAGR.
• Footer Credit: Source – Company DRHP | Credit – Shikshan Nivesh Research
---
#### 🟩 TAB 4 — Financial Performance
| Metric | FY23 | FY24 | FY25 | CAGR |
| Revenue (₹ cr) | | | | |
| EBITDA (₹ cr) | | | | |
| EBITDA Margin (%) | | | | |
| PAT (₹ cr) | | | | |
| Net Margin (%) | | | | |
• Chart 4 — Revenue / EBITDA / PAT Trend.
• Footer Credit: Source – Company DRHP | Credit – Shikshan Nivesh Research
---
#### 🟩 TAB 5 — Balance Sheet & Leverage
| Metric | FY23 | FY24 | FY25 |
| Total Assets (₹ cr) | | | |
| Net Worth (₹ cr) | | | |
| Total Debt (₹ cr) | | | |
| Debt/Equity (x) | | | |
• Chart 5 — Debt/Equity Trend & Post-IPO Effect.
• Footer Credit: Source – Company DRHP | Credit – Shikshan Nivesh Research
---
#### 🟩 TAB 6 — Cash Flow Profile
• Table: OCF, CapEx, FCF (FY23–FY25).
• Chart 6 — OCF vs PAT.
• Footer Credit: Source – Company DRHP | Credit – Shikshan Nivesh Research
---
#### 🟩 TAB 7 — IPO Offer & Use of Proceeds
| Particulars | ₹ crore | % of Issue |
| Fresh Issue | | |
| Offer for Sale | | |
| Total Issue Size | | |
• Chart 7 — Use of Proceeds (Pie).
• Footer Credit: Source – Company DRHP | Credit – Shikshan Nivesh Research
---
#### 🟩 TAB 8 — Promoter & Management
• Table: Promoters & key executives with shareholding %.
• Chart 8 — Pre vs Post IPO Shareholding.
• Footer Credit: Source – Company DRHP | Credit – Shikshan Nivesh Research
---
#### 🟩 TAB 9 — Peer Comparison & Valuation
| Company | FY25 Revenue | EBITDA Margin | PAT Margin | P/E | EV/EBITDA | ROE (%) |
| Peer 1 | | | | | | |
| Peer 2 | | | | | | |
| <Company Name> | | | | | | |
• Chart 9 — Relative Valuation (Scatter Plot).
• Footer Credit: Source – Company DRHP | Credit – Shikshan Nivesh Research
---
#### 🟩 TAB 10 — Key Risks & Red Flags
• Table & Chart 10 — Risk Heat Map (High/Medium/Low).
• Footer Credit: Source – Company DRHP | Credit – Shikshan Nivesh Research
---
#### 🟩 TAB 11 — Analyst & Media Commentary
• Table: Public analyst and media insights.
• Chart 11 — Sentiment Distribution Bar.
• Footer Credit: Source – Public Media Reports | Credit – Shikshan Nivesh Research
---
#### 🟩 TAB 12 — Overall Assessment
• Rating Scale (1–5, 0.5 steps).
• Chart 12 — Overall Rating Gauge.
• Footer Credit: Compiled by Shikshan Nivesh Research
---
### DASHBOARD SETTINGS
• Theme: Dark (#101010) background, #EDEDED text.
• Highlights: #00B050 (green), #FF4D4D (red).
• Font Family: “Inter”, fallback “Roboto”.
– Headlines 18–20 pt SemiBold
– Tables 14–15 pt Medium
– Numbers 15 pt Roboto Mono
– Commentary 14 pt Regular (line-height 1.5)
• Layout: Left panel (tables) / Right panel (charts).
• Top tab navigation fixed.
---
### RULES
• Use only DRHP and SEBI data — no forecasts or speculation.
• Round financials to ₹ crore (one decimal).
• Keep tone neutral and fact-based.
---
### DISCLAIMER TAB (Auto-Generated)
“This dashboard is prepared from publicly available DRHP filings and SEBI disclosures for <Company Name>.
It is produced for educational and analytical purposes only and does not constitute investment advice.
Research and Visual Framework by Shikshan Nivesh Research.”
---
### END OF PROMPTIn Summary
The DRHP-Based IPO Dashboard makes IPO analysis fast, transparent, and structured.
It reads the prospectus, extracts insights, and visualises everything in minutes.
IPO research now begins with DRHP + AI.
Bonus Tool: Try the SuperAnalyst Command Centre (Basic)Free
If you’d like to take this even further, you can now access my SuperAnalyst Command Centre, Basic Version absolutely free.
It’s a conference call analyzer built for analysts, students, and investors who want to:
Decode management tone and intent in minutes
Run prompt templates for quarterly results & management commentary
Generate AI-based summaries with sentiment and guidance signals
Standardize how you analyze calls across multiple sectors
You don’t need to build anything, it’s ready to use.
👉 Access here: SuperAnalyst Command Centre (Basic Version)
(Includes all core prompts and AI templates I personally use during every results season.)
🤝 Help Us Grow This Circle
Thank you for reading and supporting Alpha with AI. If you share this edition with even one person who might find it valuable, it means the world to us and helps this project reach those who need it most.
You use Gmail? Do this:
If you use Gmail, you might never receive my emails in your inbox. But you can fix this in 10 seconds:
Reply to this email with “hello!”.
Move this email to your Primary folder like this:
📩 What’s Next
You’ll now receive one new AI-based finance or research workflow every week, covering topics like research automation, portfolio decoding, valuation models, and data visualization.
If you’d prefer not to get these updates, you can unsubscribe.
Otherwise, welcome aboard, this is the next edition of Alpha with AI.
At Shikshan Nivesh, our goal is simple, to make financial research faster, smarter, and more accessible.
Because the future of analysis isn’t about who knows Excel best.
It’s about who builds thinking systems that scale.
Written by Shubham Borkar | Research & Insights by Shikshan Nivesh AI Team
Financial Clarity. Insightful Ideas.
Disclaimer
This Guide & Prompt Kit and its outputs are for educational and research purposes only. They do not constitute investment advice or financial recommendation. Always verify disclosures and consult qualified professionals before making investment or business decisions.
Links & Follow
Thank you for being part of the Shikshan Nivesh community.
▶️ For video explainers on AI, finance, and smart investing, subscribe to our YouTube channel Alpha with AI
💬 Join our WhatsApp community for regular updates on finance, AI, and smart investing tools.


