

I Taught AI to Read a Company's Earnings Before Wall Street Does. The Tell Is on Its Calendar.
A company that just beat fills its investor calendar. One that missed goes quiet. I learned this tell on a trading floor and rebuilt it with AI to run on any stock, any quarter.

For years I traded off one number. The estimate.
Consensus said a company would earn this much. Analysts said buy, hold, or sell. I positioned around it, and so did everyone else on the floor. The entire job was reading what a room full of analysts thought a company was about to do.
It took me an embarrassingly long time to see the obvious problem.
The analysts were guessing. They had the same filings I had, the same models, the same blind spots. When they were wrong, they were all wrong together, and I was wrong right alongside them. I was spending my days reading the forecasts of people standing outside the company, trying to predict the inside.
Nobody around me was watching the one group that already knew the answer.
The company itself.
I learned this years later, on a broking desk in Bombay, from an older trader who barely looked at estimates. He watched what companies did after they reported, not what analysts predicted before. And he showed me a tell I have never been able to unsee since.
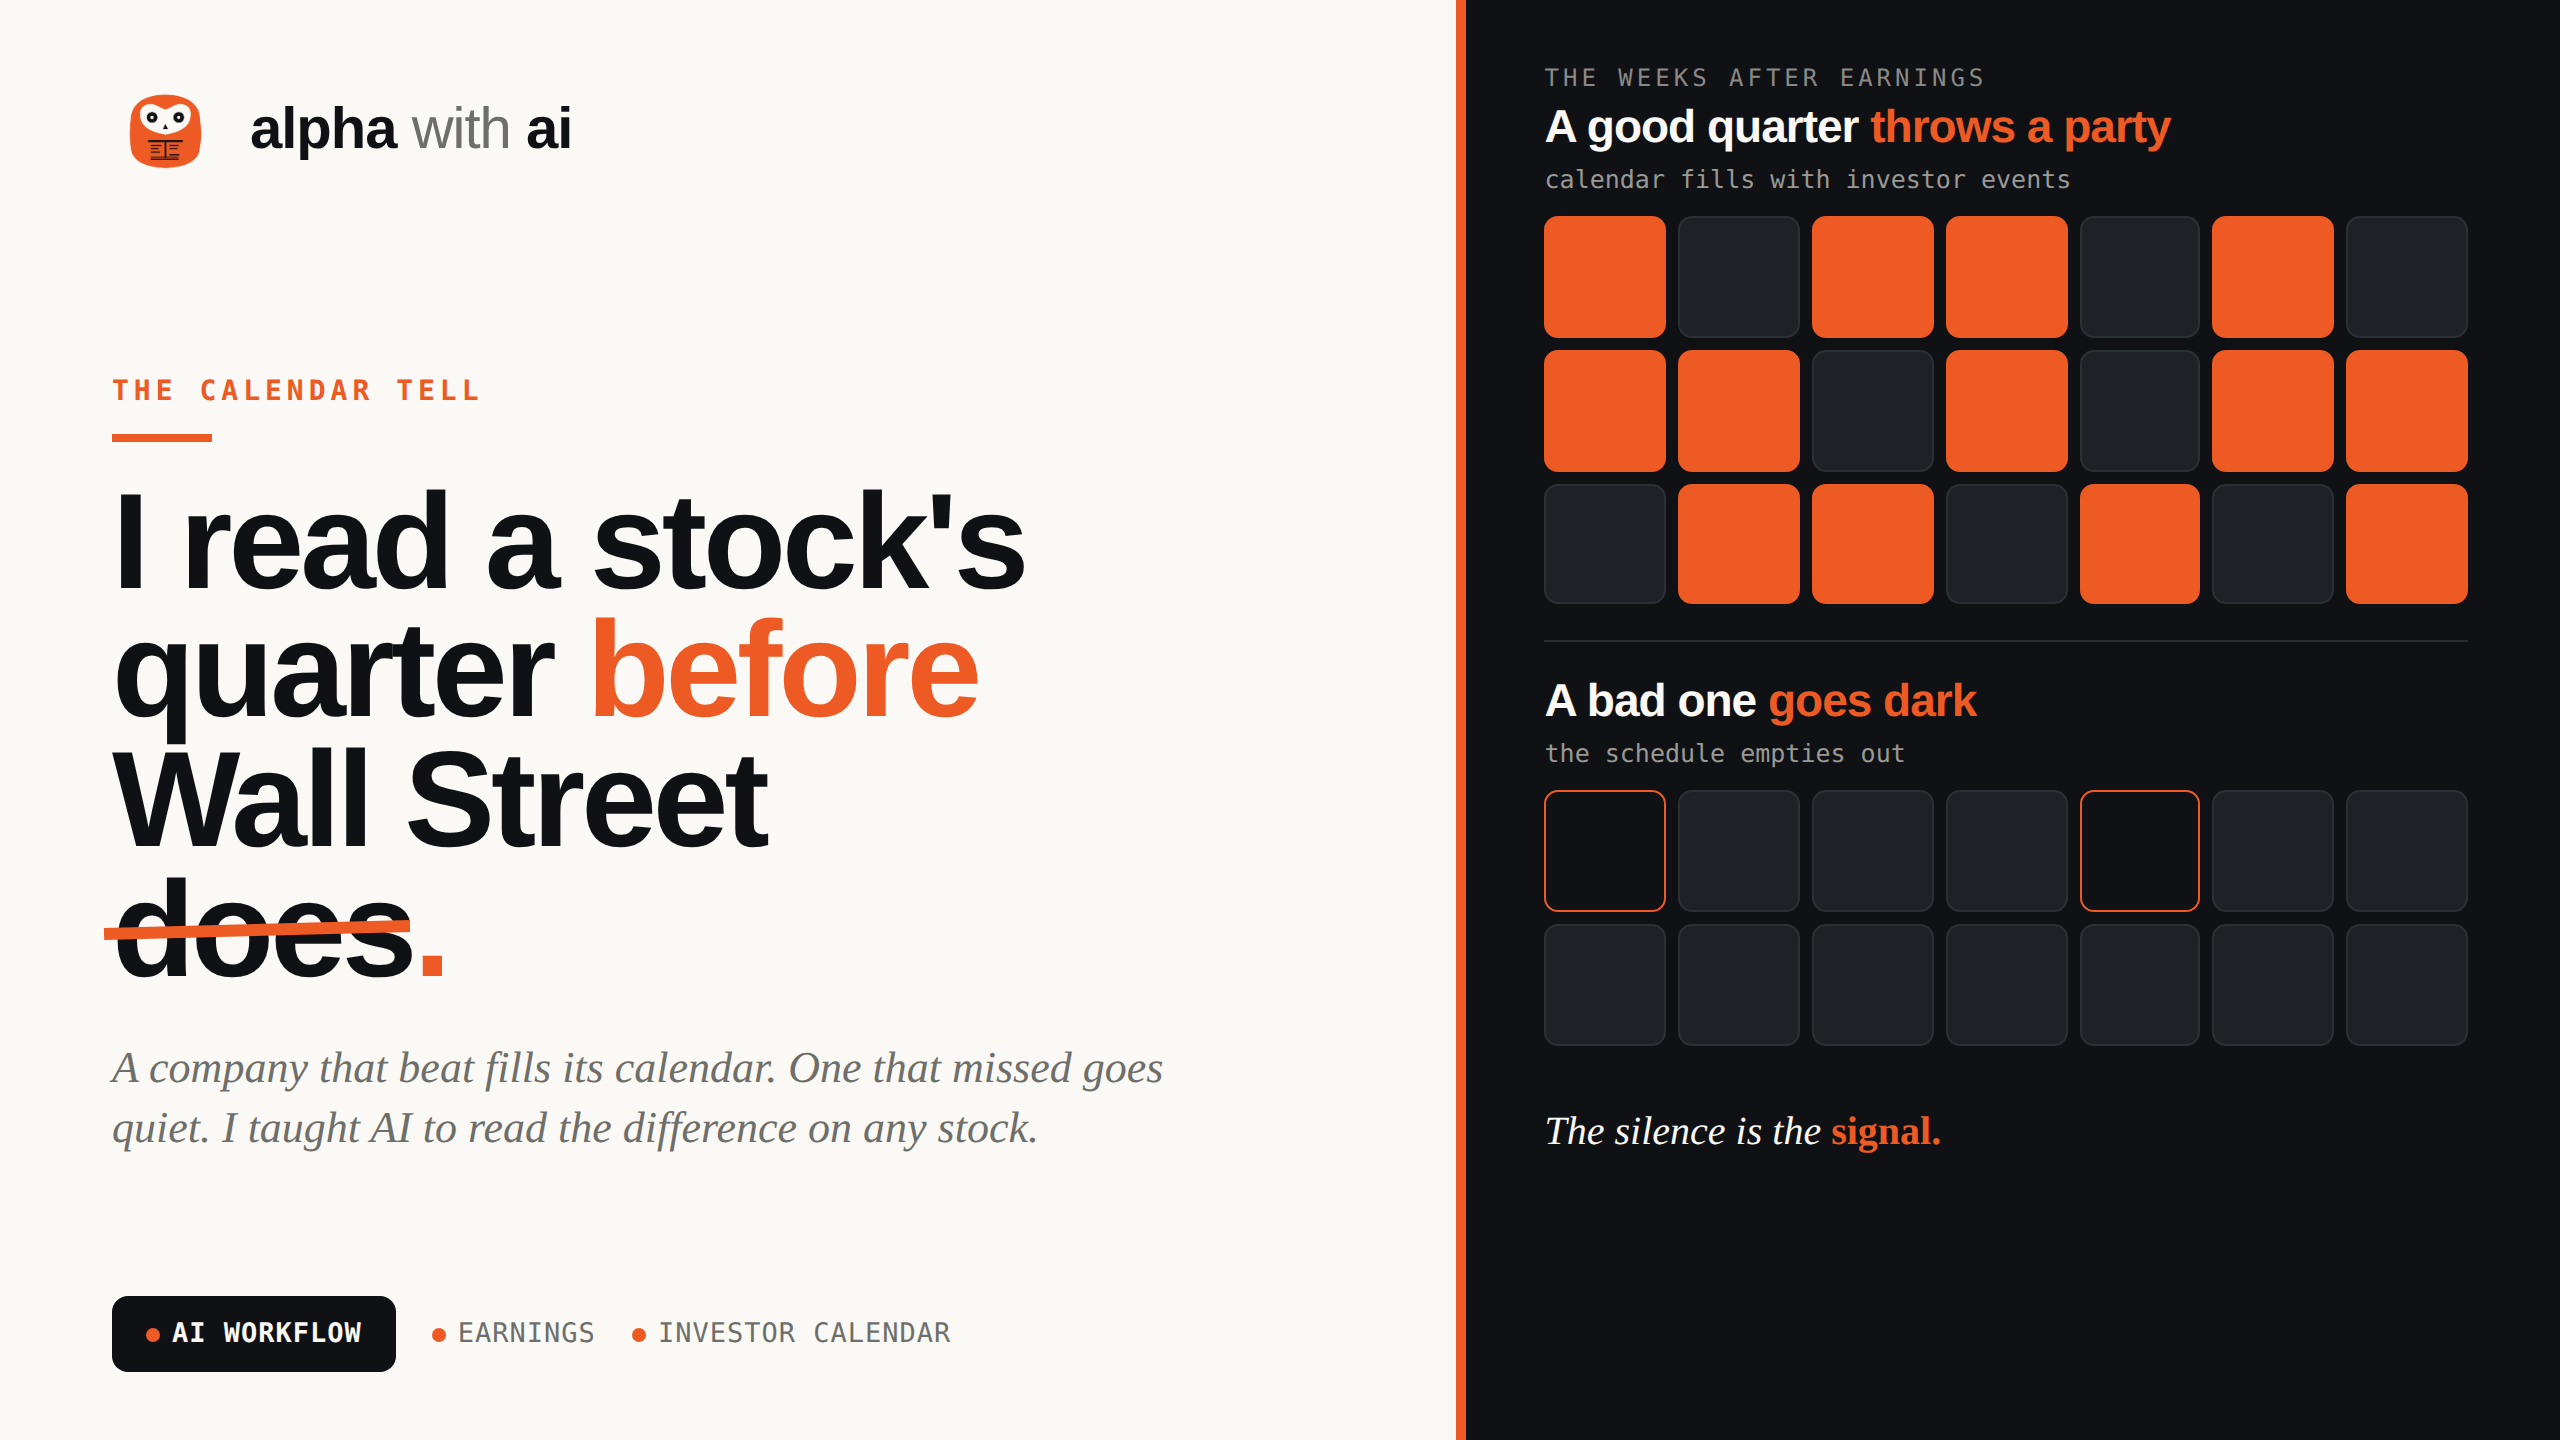
A company that just had a great quarter wants the whole world to look. The moment the numbers are out, it fills its calendar. Investor conferences, fireside chats, webcasts, roadshows, one after another for the next month and a half. It is throwing a party and sending invitations.
A company that just had a bad quarter does the opposite. It goes quiet. The calendar empties out. Fewer events, less marketing, a schedule with suddenly nothing on it. It is not hiding the numbers, those are already public. It is hiding from the conversation about them.
The company is voting on its own quarter with its own calendar. And that calendar is public, sitting on the investor relations page, weeks before any analyst updates a model.
Once you see it, you cannot stop seeing it. A full post-earnings calendar is confidence. A bare one is fear.
The best part is what comes next. This is not a read you do once, on one stock. It is a read you can run on every company you will ever hold, on every quarter, for as long as you invest. The same tell, the same hour after earnings, forever.
So I built it into something I can point at any ticker on demand. Take Lululemon. It just cut its guidance, the whole street turned against it, and Michael Burry started buying it anyway. I am going to run my whole read on it in front of you, live. I used Claude Code for this, but if that word makes you nervous, you can do the same thing in Claude Cowork. It is plain English the whole way down.
I build the AI research workflows I wish I’d had on the equity desk, then show you exactly how they run on real companies. Free to join ~5000 investors reading along. Subscribe and the next one lands in your inbox.
Why a Beat Throws a Party and a Miss Goes Dark
Think about what a company actually controls after it reports.
It does not control the numbers. Those are set the moment the quarter closes. It does not control what analysts write, or where the stock opens the next morning. All of that is out of its hands by the time the press release goes out.
But it controls one thing completely. Its own calendar.
In the weeks after earnings, management decides how visible it wants to be. It chooses whether to show up at the big bank’s tech conference. Whether to host a fireside chat. Whether the CEO sits for a webcast, whether the CFO goes on a roadshow, whether the investor relations team books anything at all. Every one of those is a choice, made by people who saw the full quarter before anyone outside the building did.
And here is the thing about people who feel good about their work. They want to be seen doing it.
A company that just beat, raised guidance, and likes its own story cannot wait to get in front of investors. It books everything. The four to six weeks after the print fill up with appearances, because every appearance is a chance to repeat a good story to the exact people who move the stock. A strong quarter wants an audience.
A company that just missed, or guided down, or knows the next quarter looks shaky, has the opposite instinct. Every investor event is now a room full of people asking the one question management does not want to answer. So the events quietly do not get booked. The calendar after a weak quarter is thin, not because nothing is happening, but because management has nothing it wants to stand up and defend.
This is not a theory about what companies should do. It is a pattern in what they actually do, and you can watch it happen in public. The investor relations page lists every scheduled event. The conference organizers publish their speaker lineups. None of it is hidden. It is just that almost nobody reads a calendar as a signal, because we are all trained to read the forecast instead.
That older trader’s whole edge was reading the thing everyone else ignored.
One honest caution before we go further, because I will not sell you a crystal ball. This is a tell, not a guarantee. A light calendar can mean a company in a quiet period, or one that simply does not market much. A packed one can be a coincidence of conference season. The signal is real, but it is one input, the same way insider buying is one input, the same way price action is one input. You stack it with everything else you know. Used that way, it is one of the cleanest free reads available to a retail investor, and until recently it was buried in work nobody wanted to do.
That last part is what changed.
The Four Things You Actually Read
The tell is simple. Reading it well comes down to four questions, asked in order.
One thing before the questions, so you know what you are looking for. This will not predict the quarter for you. What it does is catch the moments when a company’s behavior contradicts its own story, and that gap is usually the thing worth knowing.
One. How full is the calendar right now?
Go to the company’s investor relations page and look at the four to six weeks right after the earnings date. Count the scheduled events. Conferences, fireside chats, webcasts, an investor day, the non-deal roadshows that brokers host where management spends a day meeting investors without raising a dollar. Any appearance where management stands in front of the people who move the stock. That number, on its own, tells you something. A handful of events is a company that wants to be out there. A blank stretch is a company that does not.
Two. Is that more or less than the company’s own normal?
This is the move most people miss, and it is the one that matters most. A calendar with three events means nothing in isolation. Some companies are just busier than others, and many have a rhythm to their year, a heavy season and a quiet one. So you do not compare this quarter to last quarter and stop. You compare it to the same post-earnings window across the last four or five quarters. That history is the company’s baseline. Now this quarter has something to be measured against. If a company that reliably booked four or five appearances after every recent print suddenly has one, that drop is the signal, and you can trust it is a real change and not just the slow season. You are not reading the calendar. You are reading this quarter against everything the company normally does.
Three. What did management actually guide?
The calendar tells you whether management wants to be seen. This tells you what management said when it had to speak. On every earnings call, management gives a forward number. Revenue for next quarter, a full-year range, a margin target. That number is a promise, and a promise is only worth the track record behind it. So you do two things. You read the latest guidance, up, down, or held. Then you check the last several quarters of guidance against what the company actually delivered. A management team that quietly walks its full-year number down, after a history of hitting its targets, has just told you something the headline number did not. A team that always sandbags and then beats is playing a different game, and you read a soft guide from them differently. Guidance without the track record is noise. Guidance against the track record is signal.
Four. What does the street believe, and is anyone betting the other way?
The first three moves tell you what the company thinks of itself. This one tells you what everyone else thinks, so you can find the gap. Pull the current analyst picture. Count the buys, holds, and sells. Look at the average price target against where the stock trades now. You are not looking for the rating. You are looking for disagreement. A company going quiet on its calendar, after cutting its own guidance, while analysts have already abandoned it, is one kind of setup. The same company with one famous investor loudly buying into all of that is a far more interesting one. When the behavior, the guidance, the consensus, and a contrarian all point in different directions, you are not looking at a stock. You are looking at an argument. And arguments are where the money is.
That is the entire read. Calendar now, calendar against its own history, the guidance and the track record behind it, the consensus and whoever is fighting it. Four questions, every one of them answerable from public pages.
Lululemon is sitting in exactly this kind of argument right now, which is why I picked it. It cut its full-year guidance and warned on the next quarter. The street has all but given up, Michael Burry has pointed out that of the thirty-two analysts covering it, only two rate it a buy, the most negative consensus he says he has seen for a company in this shape. And Burry whose Substack I read, has been buying it on the way down, calling the gloom overdone. Rebound Capital published a deep-dive on it too, worth your time if you want the long version. Four signals, four directions, one stock. The perfect thing to point a fresh read at.
Here is the catch, and it is the only honest objection to any of this.
Done by hand, this is an afternoon. You are clicking through an investor relations site, copying event dates into a notepad, going back five quarters and doing it again, then reading four earnings calls for the guidance, then opening three more sites to rebuild the analyst picture. By the time you finish for one stock, the moment has cooled, and you have one stock. Nobody runs this on their whole watchlist by hand. That is exactly why the signal stays underused, sitting in plain sight, ignored because the reading of it is tedious.
So I stopped reading it by hand.
What follows is the same four questions, handed to an AI that does all of it in one pass, on a stock with the whole street on one side and Burry on the other, every number traced back to a public source you can check yourself.
The Whole Thing Is One Paragraph You Type in Plain English
This is the part where most newsletters hand you a six-hundred-word prompt with roles and rules and capital letters. I am not going to do that, because the entire reason to run this inside Claude Code is that you can just talk to it.
So here is the actual thing I typed. One paragraph, plain English, the way I would explain the job to a junior analyst sitting next to me. Read it once and you will see all four moves living inside it, in order, without a single bullet point.
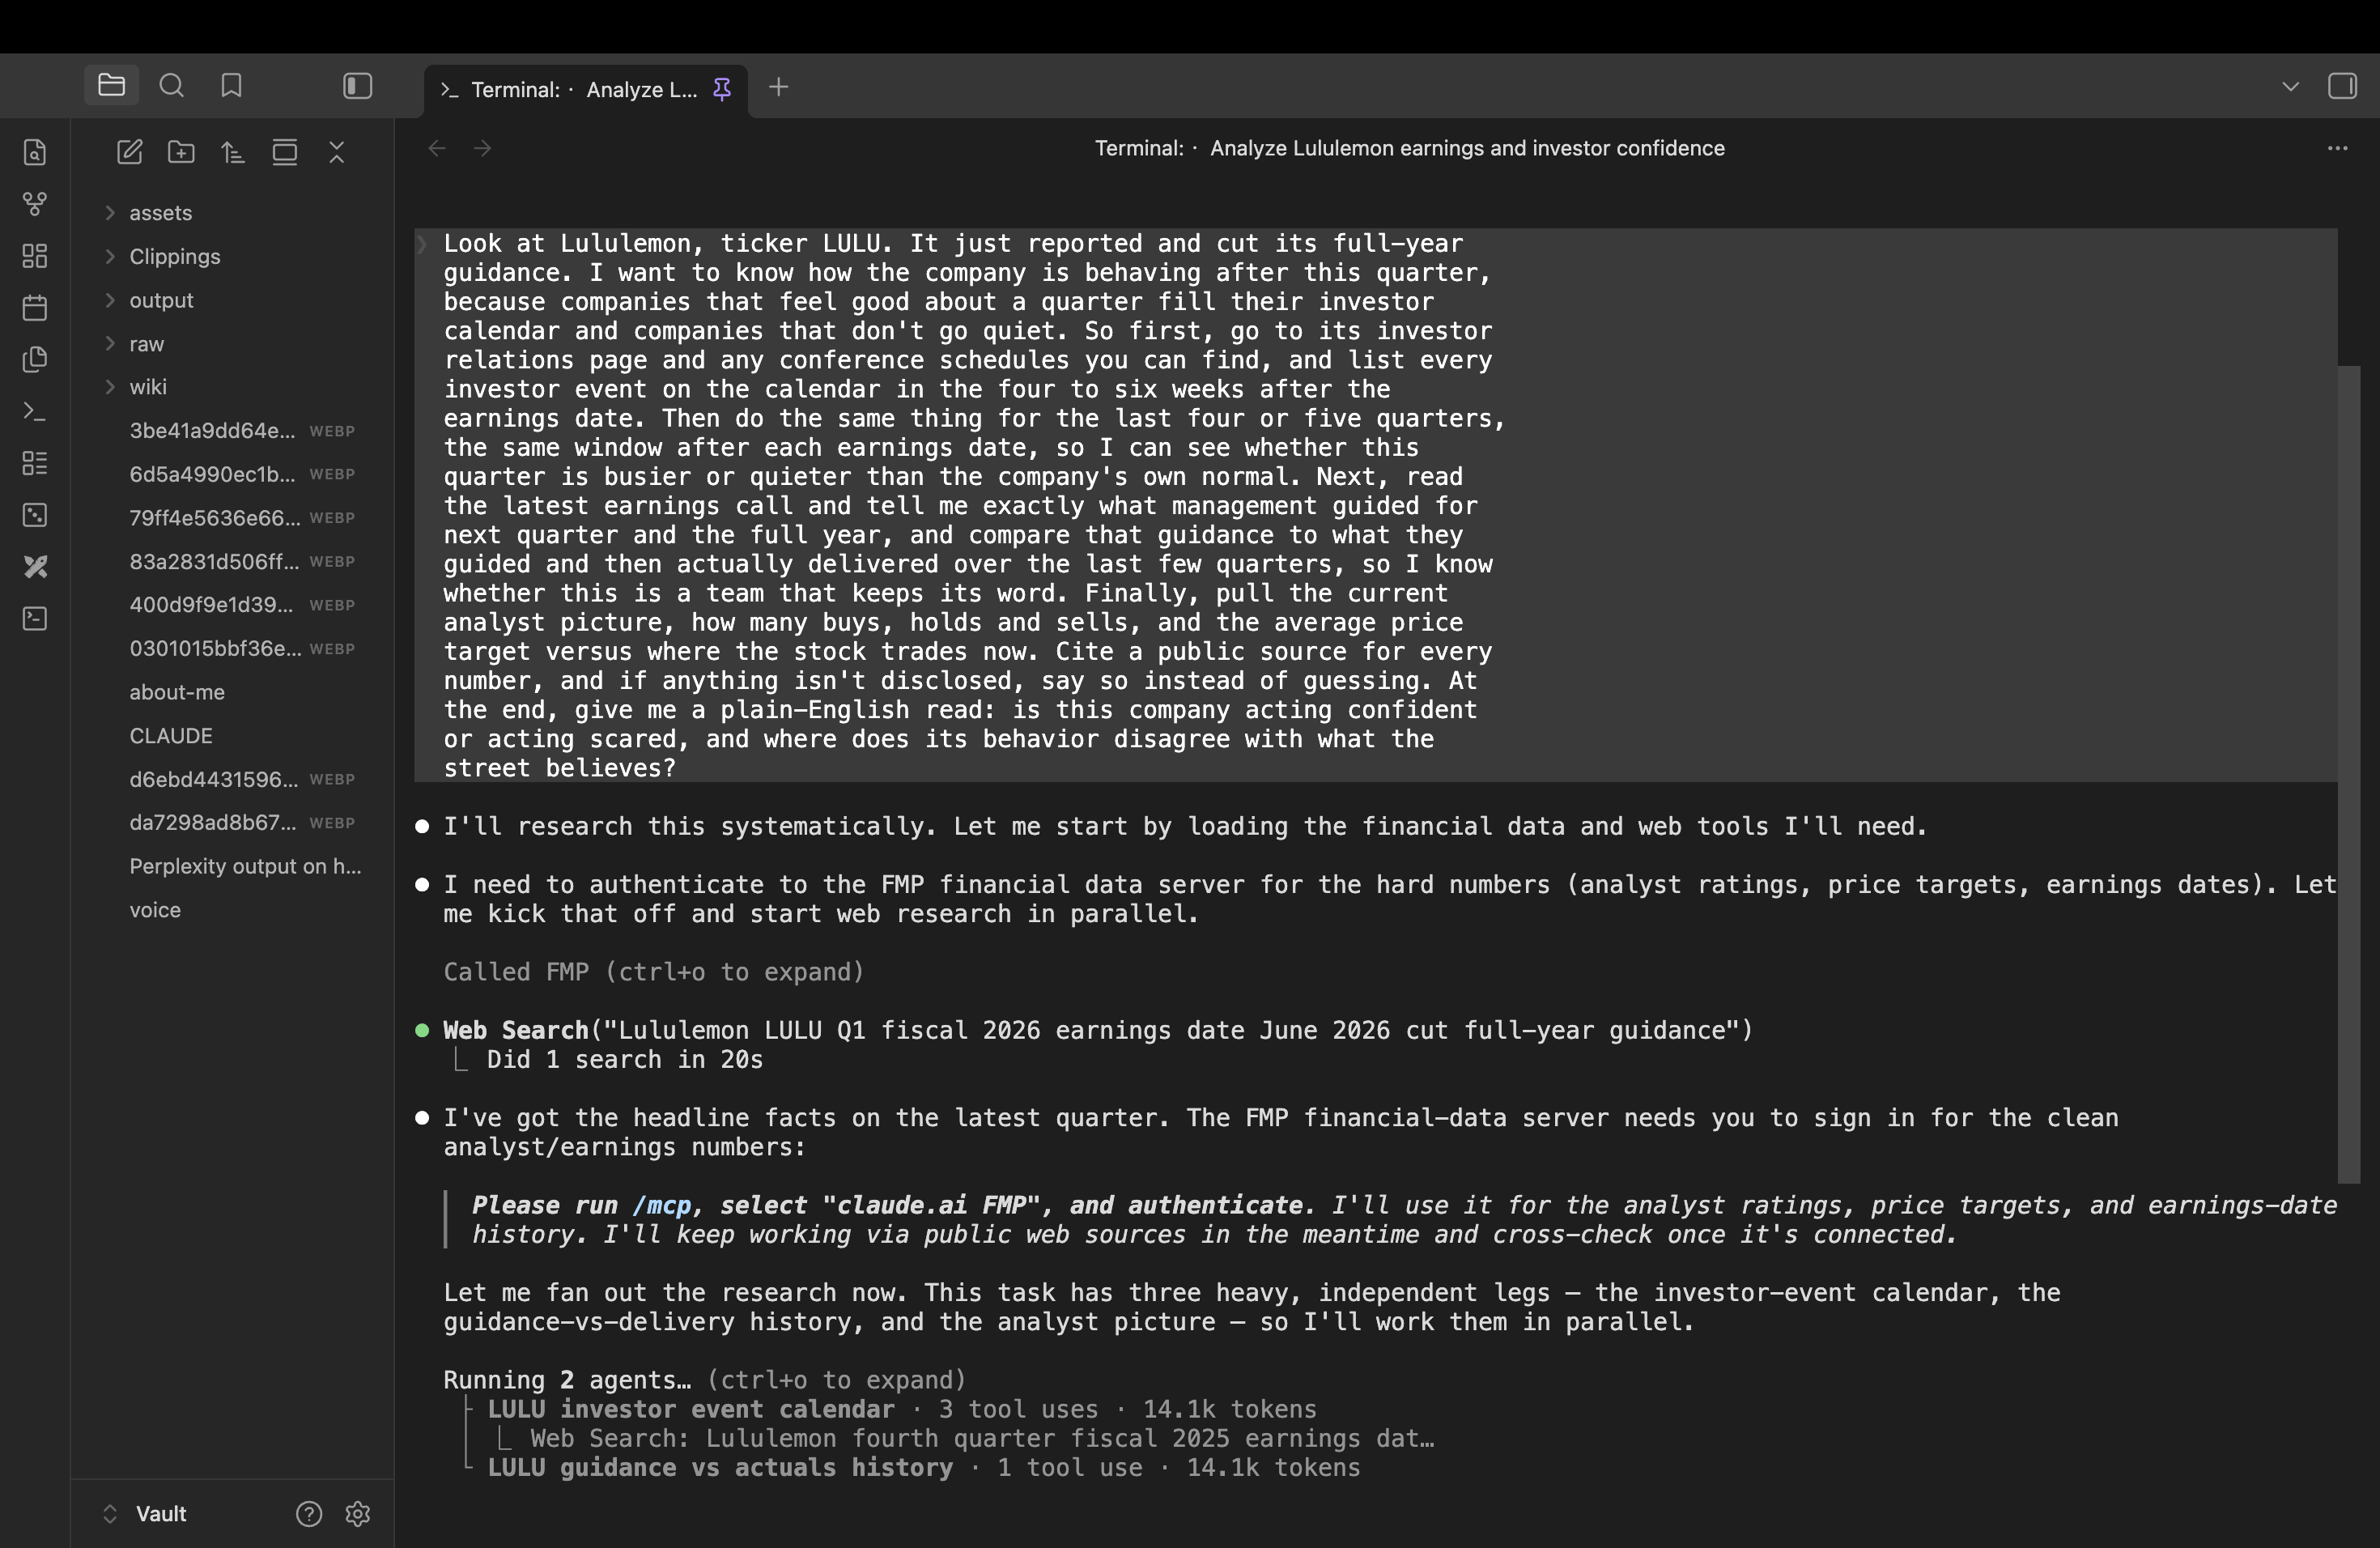
Look at Lululemon, ticker LULU. It just reported and cut its full-year guidance. I want to know how the company is behaving after this quarter, because companies that feel good about a quarter fill their investor calendar and companies that don't go quiet. So first, go to its investor relations page and any conference schedules you can find, and list every investor event on the calendar in the four to six weeks after the earnings date. Then do the same thing for the last four or five quarters, the same window after each earnings date, so I can see whether this quarter is busier or quieter than the company's own normal. Next, read the latest earnings call and tell me exactly what management guided for next quarter and the full year, and compare that guidance to what they guided and then actually delivered over the last few quarters, so I know whether this is a team that keeps its word. Finally, pull the current analyst picture, how many buys, holds and sells, and the average price target versus where the stock trades now. Cite a public source for every number, and if anything isn't disclosed, say so instead of guessing. At the end, give me a plain-English read: is this company acting confident
or acting scared, and where does its behavior disagree with what the street believes?
That is it. No setup, no persona, no formatting instructions. You could read that paragraph out loud to a person and they would know exactly what to do. That is the whole point. The model does too.
Notice what is hiding inside it. The first sentence is move one, the calendar now. The second is move two, the calendar against its own history. The third is move three, the guidance and the track record behind it. The fourth is move four, the street and the gap. The four moves are the framework. The paragraph is just the framework spoken like a human.
And here is the part I want you to take even if you stop reading here and never open Claude Code. You do not need the tool to use the idea. You can paste that paragraph into plain Claude or any CLI you already use, change the ticker, and get a usable read on any company you hold. The framework travels. The tool only makes it faster and lets you point it at ten names instead of one.
When I ran this on Lululemon, here is what came back.
I Pointed It at Lululemon. It Told Me My Own Rule Was Too Simple.
Here is the part I did not plan for.
I expected a clean win. Lululemon had just cut guidance, the street had turned, the story looked broken. The tell predicts a company in that spot goes quiet, empties its calendar, hides from the conversation. I pointed the read at it expecting to watch the calendar thin out and prove the whole thing in one screenshot.
That is not what happened. And what happened instead is worth more than the clean win would have been.
First, the run. Three ways to do this yourself, pick the one that scares you least. Open the Claude desktop app and use Claude Code or Cowork, no terminal, paste and talk. Or run it the way I do, inside Obsidian, with the terminal plugin installed from community plugins so Claude Code works right next to your notes. I walked through that whole setup in how I set up Claude Code as my investment research analyst and the Obsidian layer in the part four edition. Or if you live in a terminal, use Codex or any CLI. The paragraph is identical everywhere.
I pasted the paragraph from the last section, the plain-English one, swapped in nothing, and let it work.
The entire run, start to finish, nothing cut. This is the whole process behind the read below. Watch it pull five quarters of investor events on its own.
It did not answer from memory. It fanned the job out, hit the investor relations page, the press releases, the conference schedules, the transcripts, and pulled five quarters of history before it said a word. The whole session is in the repo, every source link intact, so you can check any number I am about to show you.
Then the answer came back, and the first thing it told me was that my hypothesis ran straight into a structural fact. Lululemon barely uses its investor calendar in any quarter at all.
Move one and two, the calendar. Here is what it actually counted, the events in the four-to-six-week window after each of the last five earnings dates:
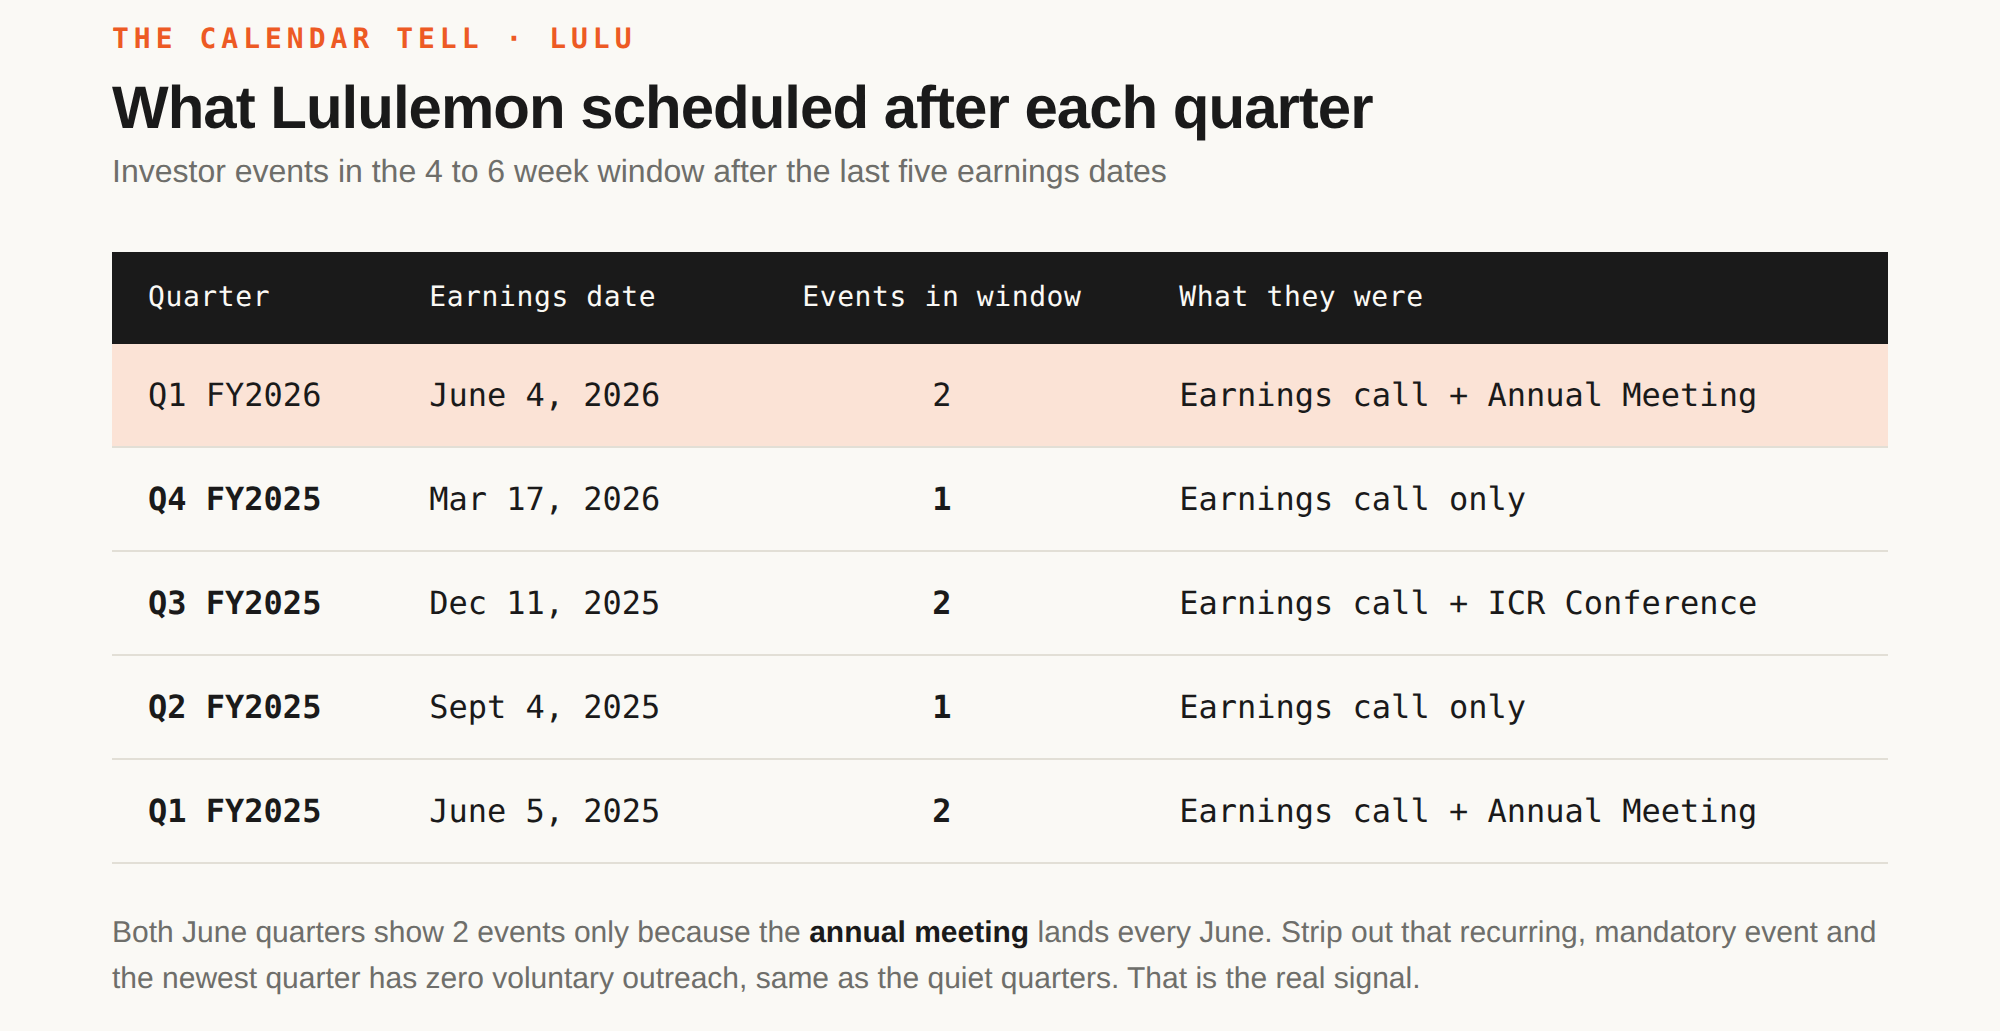
Read that and the naive version of my tell falls apart. The most recent quarter has two events, tied for the busiest of the five. If I had just counted events, I would have concluded Lululemon was feeling confident. The opposite of the truth.
The reason is the thing the model caught and I had not thought about. Some companies barely market to investors at all. Lululemon does not press-release its conference appearances. Its calendar is almost always near-empty, so there is nothing left to thin out. Run a raw event count on a company like this and the signal is just noise.
This is the moment the run earned its place in this edition. Because then it found the actual signal, the one hiding underneath the count.
The real tell was not how short the calendar got. It was what the company refused to add to it. A business down around 60 percent over the year, run by an interim team, fighting a proxy battle, did not schedule a single voluntary thing. No analyst day. No special investor update. No bonus conference circuit to stand up and defend the story. It did the legal minimum and nothing more. One of its two events this quarter was a mandatory annual meeting, and this year that meeting was a contested proxy fight tied to a Chip Wilson cooperation agreement. The company was forced into that room. It did not choose to enter it.
So the tell was right. My way of reading it was too crude. The company was hiding. It just did not need to empty a calendar to do it, because the calendar was already empty. You read the silence against the situation, not the event count against last quarter. That correction is the whole reason I am glad I ran this live instead of writing it from theory.
One honest flag on the numbers here. The analyst counts and price targets come from public aggregators, and they disagree with each other, one read of the average target, another a good bit higher. I kept both in rather than pick the flattering one. Treat them as a dated snapshot, not gospel, and check the primary source before you lean on any single figure.
Move three, the guidance, and this is where the run got sharp. This is the move you would never get from counting anything. The model read the last five quarters of guidance against what the company actually delivered, and found a split that tells you exactly how much to trust management.
Every single quarter, for five quarters running, Lululemon beat the top of its own EPS guide. Five for five. This is a team that always clears the bar it sets for the next ninety days.
And across that same stretch, it cut its full-year guidance three separate times. Beat the quarter, lower the year. Beat the quarter, lower the year. The pattern in one line: they keep their word on the short bar they set low on purpose, while the real trajectory of the business grinds down underneath them.
That is the difference between a management read and a headline. The quarterly guide is a sandbag they will probably clear again next print. The full-year guide is the one quietly telling you the franchise is deteriorating. Trust the short word. Distrust the long one.
Below the line is where this resolves. The full analyst picture and the one tension buried inside it that I think matters more than the guidance cut itself. The exact point where management’s story and the market’s story split clean in two. What Michael Burry is seeing here that the entire sell-side is not. The plain-English verdict on whether this company is acting confident or acting scared. And the finished read you can point at any stock you hold, with the whole conversation and every sourced link in the repo.
This is where the paid section begins. The free half gave you the method and the full live run. The verdict, the analyst picture, and the saved skill are below for paid subscribers. If this is the kind of work you want every edition, consider subscribing.
