


Last week, a senior research analyst reached out with a problem I didn’t expect.
He covers multiple sectors. Has done this for 20 years. The kind of analyst who’s seen enough cycles to smell trouble before it shows up in the numbers.
Yet here he was, stuck.
He wanted to initiate coverage on a new sector, one he’d never touched before. Not a hot sector with abundant sell-side research. Not something Bloomberg or Refinitiv had neatly packaged. A niche industry where the information was scattered across regulatory filings, trade body reports, and consultant PDFs buried three pages deep in Google searches.
“I need to initiate coverage on a sector I’ve never touched. The information is everywhere and nowhere. I don’t have three weeks.”
He wanted an AI system that could help. But not the usual kind.
Not one that confidently invents numbers. Not one that hallucinates trends. He wanted something he could actually trust, something that would cite its sources, admit when it didn’t know, and let him verify every claim.
So we built it.
And somewhere in the middle of that process, I realized, this isn’t his problem alone. This is every analyst entering unfamiliar territory. Every investor researching a sector before deploying capital. Every professional who’s ever stared at a new industry and thought: where do I even begin?
That’s when I decided to document everything and give it away for free.
What follows is the complete framework, the same system we built last week, refined and generalized so you can deploy it for any industry, in any geography, starting today.
The Problem with Industry Research Today
Let me describe what most people do when researching a new industry.
They open ChatGPT. Or Claude. Or Perplexity. They type something like: “Explain the specialty chemicals industry.” They get a confident, well-structured response. It sounds authoritative. The formatting is clean. The logic flows.
And that’s precisely the problem.
You have no idea which parts are real and which parts the model invented. That confident tone? It sounds the same whether the information is accurate or completely fabricated. The clean structure? It organizes facts and hallucinations with equal elegance.
I learned this the hard way.
Earlier in my career, I managed direct equity portfolios for some of India’s largest UHNI clients. In early 2024, I was researching a few small-cap names, looking for opportunities before the broader market caught on. I used AI to accelerate my research. Asked detailed questions about industry dynamics, competitive positioning, margin structures. Got confident, well-formatted answers. Built my conviction.
Then March happened.
The small-cap correction hit like a bloodbath. For a few brutal days, everything bled red. Now, corrections are part of the game, I’ve seen enough cycles to know that. But this time, something bothered me. I went back to revisit my original research. The facts I’d built my thesis on. The industry dynamics I thought I understood.
Many of those facts were completely fabricated.
Not wrong in interpretation. Fabricated. Statistics that didn’t exist. Relationships between variables that no source had ever documented. Citations that led nowhere.
We didn’t lose money, my clients were long-term investors, and the positions eventually recovered. But we lost something else. We lost opportunities. We sat on the sidelines for months, waiting for holdings to climb back, watching other ideas pass us by. All because I’d trusted AI outputs I couldn’t verify.
That experience changed how I think about AI in research.
The tools are powerful. But power without constraints is dangerous. For financial research, where a single wrong assumption can cascade into a flawed thesis, the AI needs to be tethered to verified sources. It needs to cite its work. It needs to say “I don’t know” when it doesn’t know.
That’s what we’re building today using NotebookLM.
Why NotebookLM (And Not Other AI Tools)
You might be wondering, why NotebookLM? Why not stick with ChatGPT or Claude or Perplexity? They’re faster. More conversational. Better at handling follow-up questions.
All true. And yet, for industry research, I don’t use them.
Here’s why.
NotebookLM does something other models can’t: it only answers from your uploaded sources. Every response comes with citations, page numbers, exact passages, verifiable references. When you ask it a question, it doesn’t draw from its training data. It doesn’t “know” things the way ChatGPT knows things. It searches through the documents you’ve given it and constructs answers based solely on that material.
This sounds like a limitation. It’s actually the entire point.
ChatGPT will answer any question you ask. Confidently. Fluently. Even when it’s making things up. Claude does the same. Perplexity adds citations, but those citations often don’t support the claims they’re attached to or worse, lead to pages that say something entirely different.
NotebookLM refuses to play that game. If the answer isn’t in your sources, it tells you. If a claim can’t be supported, it won’t make the claim. You lose the feeling of talking to an all-knowing oracle. You gain something far more valuable: trust.
The technical backbone:
NotebookLM runs on Gemini 3 with a full 1-million-token context window. You can upload up to 50 sources per notebook(on a free plan), hundreds of pages across annual reports, consultant studies, regulatory filings. All indexed. All searchable. All cited.
And it’s completely free. For users in India, Reliance Jio offers Google AI Pro free for 18 months through the Google AI Suite, unlocking additional features at no cost.
What NotebookLM won’t do:
It won’t access real-time information. It won’t update automatically when new reports release. It won’t connect to external databases or pull live market data.
But here’s the thing, for the kind of analysis we’re doing, you don’t need real-time. Industry structures don’t change overnight. Competitive dynamics evolve over years, not hours. The foundational research that helps you understand a sector deeply? That can be built once and updated periodically.
Real-time matters for trading. For understanding an industry? Depth matters more.
The Source Hierarchy: What to Feed Your Research Desk
Here’s something most people get wrong about AI-powered research: they focus on the tool and ignore the fuel.
You can have the most sophisticated system in the world. But if you’re feeding it garbage, you’ll get elegant garbage back. Formatted nicely. Cited properly. Still wrong.
Your analysis is only as good as your sources, and not all sources are created equal.
When I set up an industry research notebook, I follow a hierarchy. This isn’t arbitrary, it’s built from years of seeing what actually holds up when you dig deeper, and what falls apart under scrutiny.
Tier 1: Consultancy Reports
McKinsey. BCG. Bain. Deloitte. EY. KPMG. PwC. Accenture.
These firms produce some of the highest-quality industry research available. And here’s what most people don’t realize, much of it is free.
A former CXO client taught me this. When a company like Reliance or Tata wants to enter a new market, they pay these consultancies ₹2-5 Cr for a market entry study. The firm conducts rigorous primary research, surveys, expert interviews, proprietary data analysis, on-ground validation. Then, 6-12 months later, they publish a sanitised version as thought leadership content.
You’re getting 80% of the analytical value at 0% of the cost.
The trick is knowing where to find them:
McKinsey Global Institute (mckinsey.com/mgi)
BCG Henderson Institute (bcg.com/bcg-henderson-institute)
Bain Insights (bain.com/insights)
Deloitte Insights (deloitte.com/insights)
EY Insights (ey.com/insights)
World Economic Forum reports
IMF and World Bank sector studies
Tier 2: Government and Regulatory Body Reports
This is where most people stop looking. That’s a mistake.
For niche industries like paper, textiles, leather, ceramics, specialty manufacturing, consultancy coverage is sparse. Wall Street doesn’t care. Bloomberg doesn’t package it neatly.
But these industries have their own knowledge infrastructure and it’s often deeper than what you’d find for mainstream sectors.
Every significant industry has a governing body. They exist because they need to lobby for policy changes, report to government, and coordinate industry standards. Which means they produce data. Lots of it. Annual reports. White papers. Market outlooks. Trade statistics.
Industry associations like the Indian Paper Manufacturers Association. Regulatory bodies like TRAI or SEBI or the Textile Committee. Export promotion councils. Chambers of commerce.
And here’s something even fewer people know: government ministries often commission research from agencies like CRISIL, ICRA, FICCI, or CII. These commissioned reports are rigorous, they inform policy decisions and they’re usually available free on ministry websites.
For global coverage, the same principle applies. UNIDO for manufacturing. FAO for agriculture. OECD for cross-country sector analysis. European Commission industry reports. US International Trade Commission studies.
The information exists. You just have to know where to look.
Tier 3: Company Annual Reports
Once you understand the industry landscape, you need to understand the players.
Annual reports are goldmines, but not for the reasons most people think. Yes, the financials matter. But the real value is in management commentary. Risk factor disclosures. Segment breakdowns. Capital allocation discussions.
Management teams are required to discuss what’s working and what isn’t. They have to disclose risks, competitive threats, regulatory headwinds, operational challenges. Read between the lines, and you’ll learn more about industry dynamics than any consultant report will tell you.
I typically upload 5-7 annual reports from the leading players in a sector. Not just the largest companies, but a mix that covers the full value chain. Upstream. Midstream. Downstream. Domestic leaders. Global competitors.
Tier 4: AI-Generated Deep Research
Only after I’ve gathered the primary sources do I use AI to fill gaps.
Gemini Deep Research. Perplexity. ChatGPT in research mode.
These tools are useful for synthesis, connecting dots, identifying themes you might have missed, generating questions you hadn’t thought to ask. But they’re supplements, not foundations.
Use them to identify what you don’t know. Then go find real sources to answer those questions.
The Source Discovery Framework
Building Your Source Library
Now comes the part where most people get stuck.
They know they need good sources. They understand the hierarchy. But when they actually sit down to build their research library, they spend hours clicking through websites, downloading PDFs one by one, getting lost in rabbit holes that lead nowhere.
There’s a faster way.
I use a systematic approach that combines AI-powered research with strategic manual sourcing. The goal is to build a comprehensive knowledge base in hours, not weeks, one that covers an industry from every angle.
The Three Pillars of Industry Understanding
Before you can analyze an industry intelligently, you need to understand three things:
How did we get here? — The historical forces that shaped the industry
Where is it going? — The growth drivers, constraints, and future scenarios
How does the money actually flow? — The operational mechanics and unit economics
I call these the Origin, Trajectory, and Engine of an industry. Miss any one of them, and your understanding has a blind spot.
To build this foundational knowledge, I use Gemini Deep Research to generate comprehensive reports on each pillar. Why Gemini specifically? It runs on Gemini 3 Pro, Google’s most factual model, specifically trained to reduce hallucinations during complex research tasks. It browses hundreds of websites, synthesizes information, and produces detailed, citation-backed reports.
A quick note: NotebookLM also has a Deep Research feature now, and you can use it if you prefer keeping everything in one place. It currently runs on Gemini 3 Flash, still powerful, but slightly less capable than Pro. Google has announced they’ll soon integrate the Gemini 3 Pro version into NotebookLM, so this gap will close. For now, I recommend using Gemini Deep Research for these foundational reports, then importing everything into NotebookLM for analysis.
The Workflow
Open Gemini (gemini.google.com)
Select “Deep Research” mode from the prompt bar
Paste each prompt below (one at a time)
Let it run, takes 3-5 minutes per report
Export each report as a google doc.
Import all three docs into your NotebookLM notebook
Let me share the exact prompts I use.
Prompt 1: Industry Origin (Historical Analysis)
ROLE
You are an economic historian and industry analyst specializing in [Industry Name] in [Country/Region].

OBJECTIVE
Create a comprehensive historical analysis (~ 10,000 words) that explains how this industry formed, evolved, and produced its current structure. Focus on cause-and-effect relationships and patterns that inform investment thinking.

RESEARCH FOCUS

1. Formation
- What problem or need created this industry?
- What were the first technologies, business models, and institutions?
- Who were the early pioneers and what advantages did they have?

2. Evolution & Expansion
- What breakthroughs enabled scale?
- How did costs, productivity, and barriers to entry change over time?
- When and how did the industry go from local to national to global?

3. Regulatory & Crisis Moments
- What major shocks reshaped the industry structure?
- How did government policy and regulation evolve?
- Which crises led to consolidation, and which opened doors for new entrants?

4. Competitive Dynamics
- How did winning companies build and sustain their edge?
- What caused once-dominant players to fail?
- What were the major turning points in market share?

5. Key Players Across Eras
- Who dominated in each major period?
- What drove leadership transitions?
- Which mergers, acquisitions, or breakups reshaped the landscape?

6. Modern Transformation
- How have digital technologies and automation changed the industry?
- What new business models have emerged in the last decade?
- How have margins and capital requirements shifted?

7. Regional Variations
- How do different geographies differ in industry structure?
- What role do trade policies, subsidies, and local regulations play?

8. Capital & Returns
- How has the industry been financed across different eras?
- What have returns looked like for investors over time?
- How has investor perception and valuation evolved?

OUTPUT REQUIREMENTS
- Use specific data, dates, and examples wherever possible
- Cite sources for key claims
- Identify recurring patterns that repeat across industry cycles
- Conclude with 5-7 key insights relevant for long-term investors
Prompt 2: Industry Trajectory (Growth & Future Outlook)
ROLE
You are an industry strategist and analyst specializing in [Industry Name] in [Country/Region].

OBJECTIVE
Create a forward-looking analysis (~ 10,000 words) that explains the current state, growth drivers, structural constraints, and plausible future scenarios for this industry. Focus on actionable insights for investors and business leaders.

RESEARCH FOCUS

1. Current State
- What is the market size, segmentation, and value chain structure?
- Where are the profit pools concentrated?
- Who are the key players and what are their market positions?
- What is the geographic distribution of demand and supply?

2. Growth Drivers
- What demand-side factors are driving growth? (demographics, consumption patterns, adoption curves)
- What supply-side factors are enabling expansion? (capacity additions, cost improvements, innovation)
- What policy or regulatory tailwinds exist?

3. Constraints & Headwinds
- What regulatory, resource, or environmental limits constrain growth?
- Where is competitive intensity creating pricing pressure?
- What substitution risks exist from adjacent industries or technologies?
- How does cyclicality affect the industry?

4. Technology Evolution
- What technologies are having material economic impact?
- How are cost curves expected to shift over the next 5-10 years?
- What role will automation, AI, and data play in reshaping margins?

5. Competitive Landscape Shifts
- Who are the emerging challengers and disruptors?
- What consolidation trends are underway?
- Which economic moats are strengthening, and which are eroding?

6. Scenarios (5-10 Year Horizon)
- Base case: What happens if current trends continue?
- Upside case: What could accelerate growth beyond expectations?
- Downside case: What shocks could derail the industry?
- Assign rough probability estimates and identify leading indicators for each scenario

7. Financial Outlook
- What are realistic expectations for revenue growth, margins, and return on capital?
- How capital-intensive is growth likely to be?
- What valuation frameworks are most appropriate for this industry?

8. Strategic Implications
- What capabilities and assets will define winners in the next decade?
- Where should capital flow, and where should it avoid?
- What structural risks must investors monitor?

OUTPUT REQUIREMENTS
- Use current data and cite sources
- Be specific about timeframes and magnitudes
- Distinguish between high-confidence projections and speculative scenarios
- Conclude with a clear summary of the investment implications
Prompt 3: Industry Engine (Operations & Economics)
ROLE
You are an industry economist and operations analyst specializing in [Industry Name] in [Country/Region].

OBJECTIVE
Create a technical analysis (~ 10,000 words) that explains exactly how this industry operates — how inputs become outputs, how money flows through the system, and what separates excellent operators from mediocre ones. Focus on the mechanics that drive profitability.

RESEARCH FOCUS

1. Value Chain Architecture
- Map every stage from raw inputs to end customer
- Identify the key actors at each stage (suppliers, manufacturers, distributors, retailers, platforms)
- Quantify where value is created and captured
- Explain how materials, information, and cash flow through the system

2. Revenue Models
- What are the typical pricing mechanisms? (per-unit, subscription, spread-based, fee-based)
- How do companies balance capacity utilization vs. demand management?
- What is the mix of fixed vs. variable revenue?
- How sensitive is pricing to input cost changes?

3. Cost Structure Deep-Dive
- Break down operating costs: raw materials, energy, labor, logistics, depreciation, maintenance, marketing, regulatory compliance
- What percentage does each cost category represent?
- Where are the economies of scale, scope, and density?
- What costs are fixed vs. variable, and where are the non-linear behaviors?

4. Working Capital Dynamics
- What are typical payment cycles? (receivables, payables, inventory days)
- What drives cash conversion efficiency?
- Are there seasonal patterns in cash flow?
- How do prepayments, float, or deferred revenue affect the business?

5. Asset Base & Capital Requirements
- What does the typical asset base look like? (plants, equipment, technology, licenses)
- How capital-intensive is this industry?
- What is the split between maintenance capex and growth capex?
- How does operating leverage affect profitability at different utilization levels?

6. Labor & Productivity
- What portion of costs is labor?
- What is the skill composition of the workforce?
- What is the automation potential?
- How do labor regulations and unionization affect cost flexibility?

7. Technology & Process
- What core technologies drive efficiency?
- How much do companies spend on IT and process improvement?
- What process innovations have materially changed margins in recent years?

8. Regulatory & Compliance Costs
- What mandatory compliance processes exist? (safety, environmental, quality, data)
- How do these affect throughput, cost, and ability to scale?
- Are there licensing or certification bottlenecks?

9. Risk & Resilience
- What are the key operational risks? (supply disruption, energy prices, logistics)
- Where are single points of failure?
- How do leading companies build redundancy?
- What macro variables most affect operations? (interest rates, currency, commodity prices)

10. Performance Benchmarks
- What are the core KPIs? (gross margin, EBITDA margin, ROCE, asset turnover, capacity utilization)
- What do median vs. top-quartile performers look like?
- Which operating metrics most strongly predict long-term value creation?

11. What Separates the Best Operators
- What practices do industry leaders consistently use?
- Quantify the margin or return advantage of best-in-class operations
- What can investors look for to identify operational excellence?

OUTPUT REQUIREMENTS
- Be specific and quantitative wherever possible
- Use industry-specific terminology and metrics
- Cite sources for benchmarks and data points
- Conclude with a checklist of operational factors investors should evaluate
After Running the Prompts
Once you have all three reports, export them as google docs from Gemini. These become your foundational sources, your AI analyst’s crash course on the industry.
But they’re just the beginning.
Now comes the layering.
Step 1: Import Your Foundation
Open NotebookLM and create a new notebook. Import your three Gemini Deep Research docs. You’ve used 3 of your 50 source slots(free plan), and you already have a comprehensive knowledge base covering the industry’s origin, trajectory, and operating mechanics.
Step 2: Add Company Annual Reports
Before using NotebookLM’s discovery features, manually add 5-7 annual reports from companies across the value chain. These give you ground-truth data that no AI-generated report can match, management commentary, segment breakdowns, risk disclosures, capex plans.
For a specialty chemicals analysis, you might add:
2 upstream players (raw material suppliers)
2-3 midstream manufacturers (the core industry)
2 downstream customers or distributors
Download these directly from company investor relations pages or screeners and upload them as PDFs. You’ve now used roughly 10 of your 50 slots.
Step 3: Discover Additional Sources (The Smart Way)
Here’s where NotebookLM’s native intelligence shines.
NotebookLM’s ‘Discover Sources’ feature understands Google search operators. This means you can be surgical about what it finds. Instead of a vague topic description, use structured prompts that target specific source types.
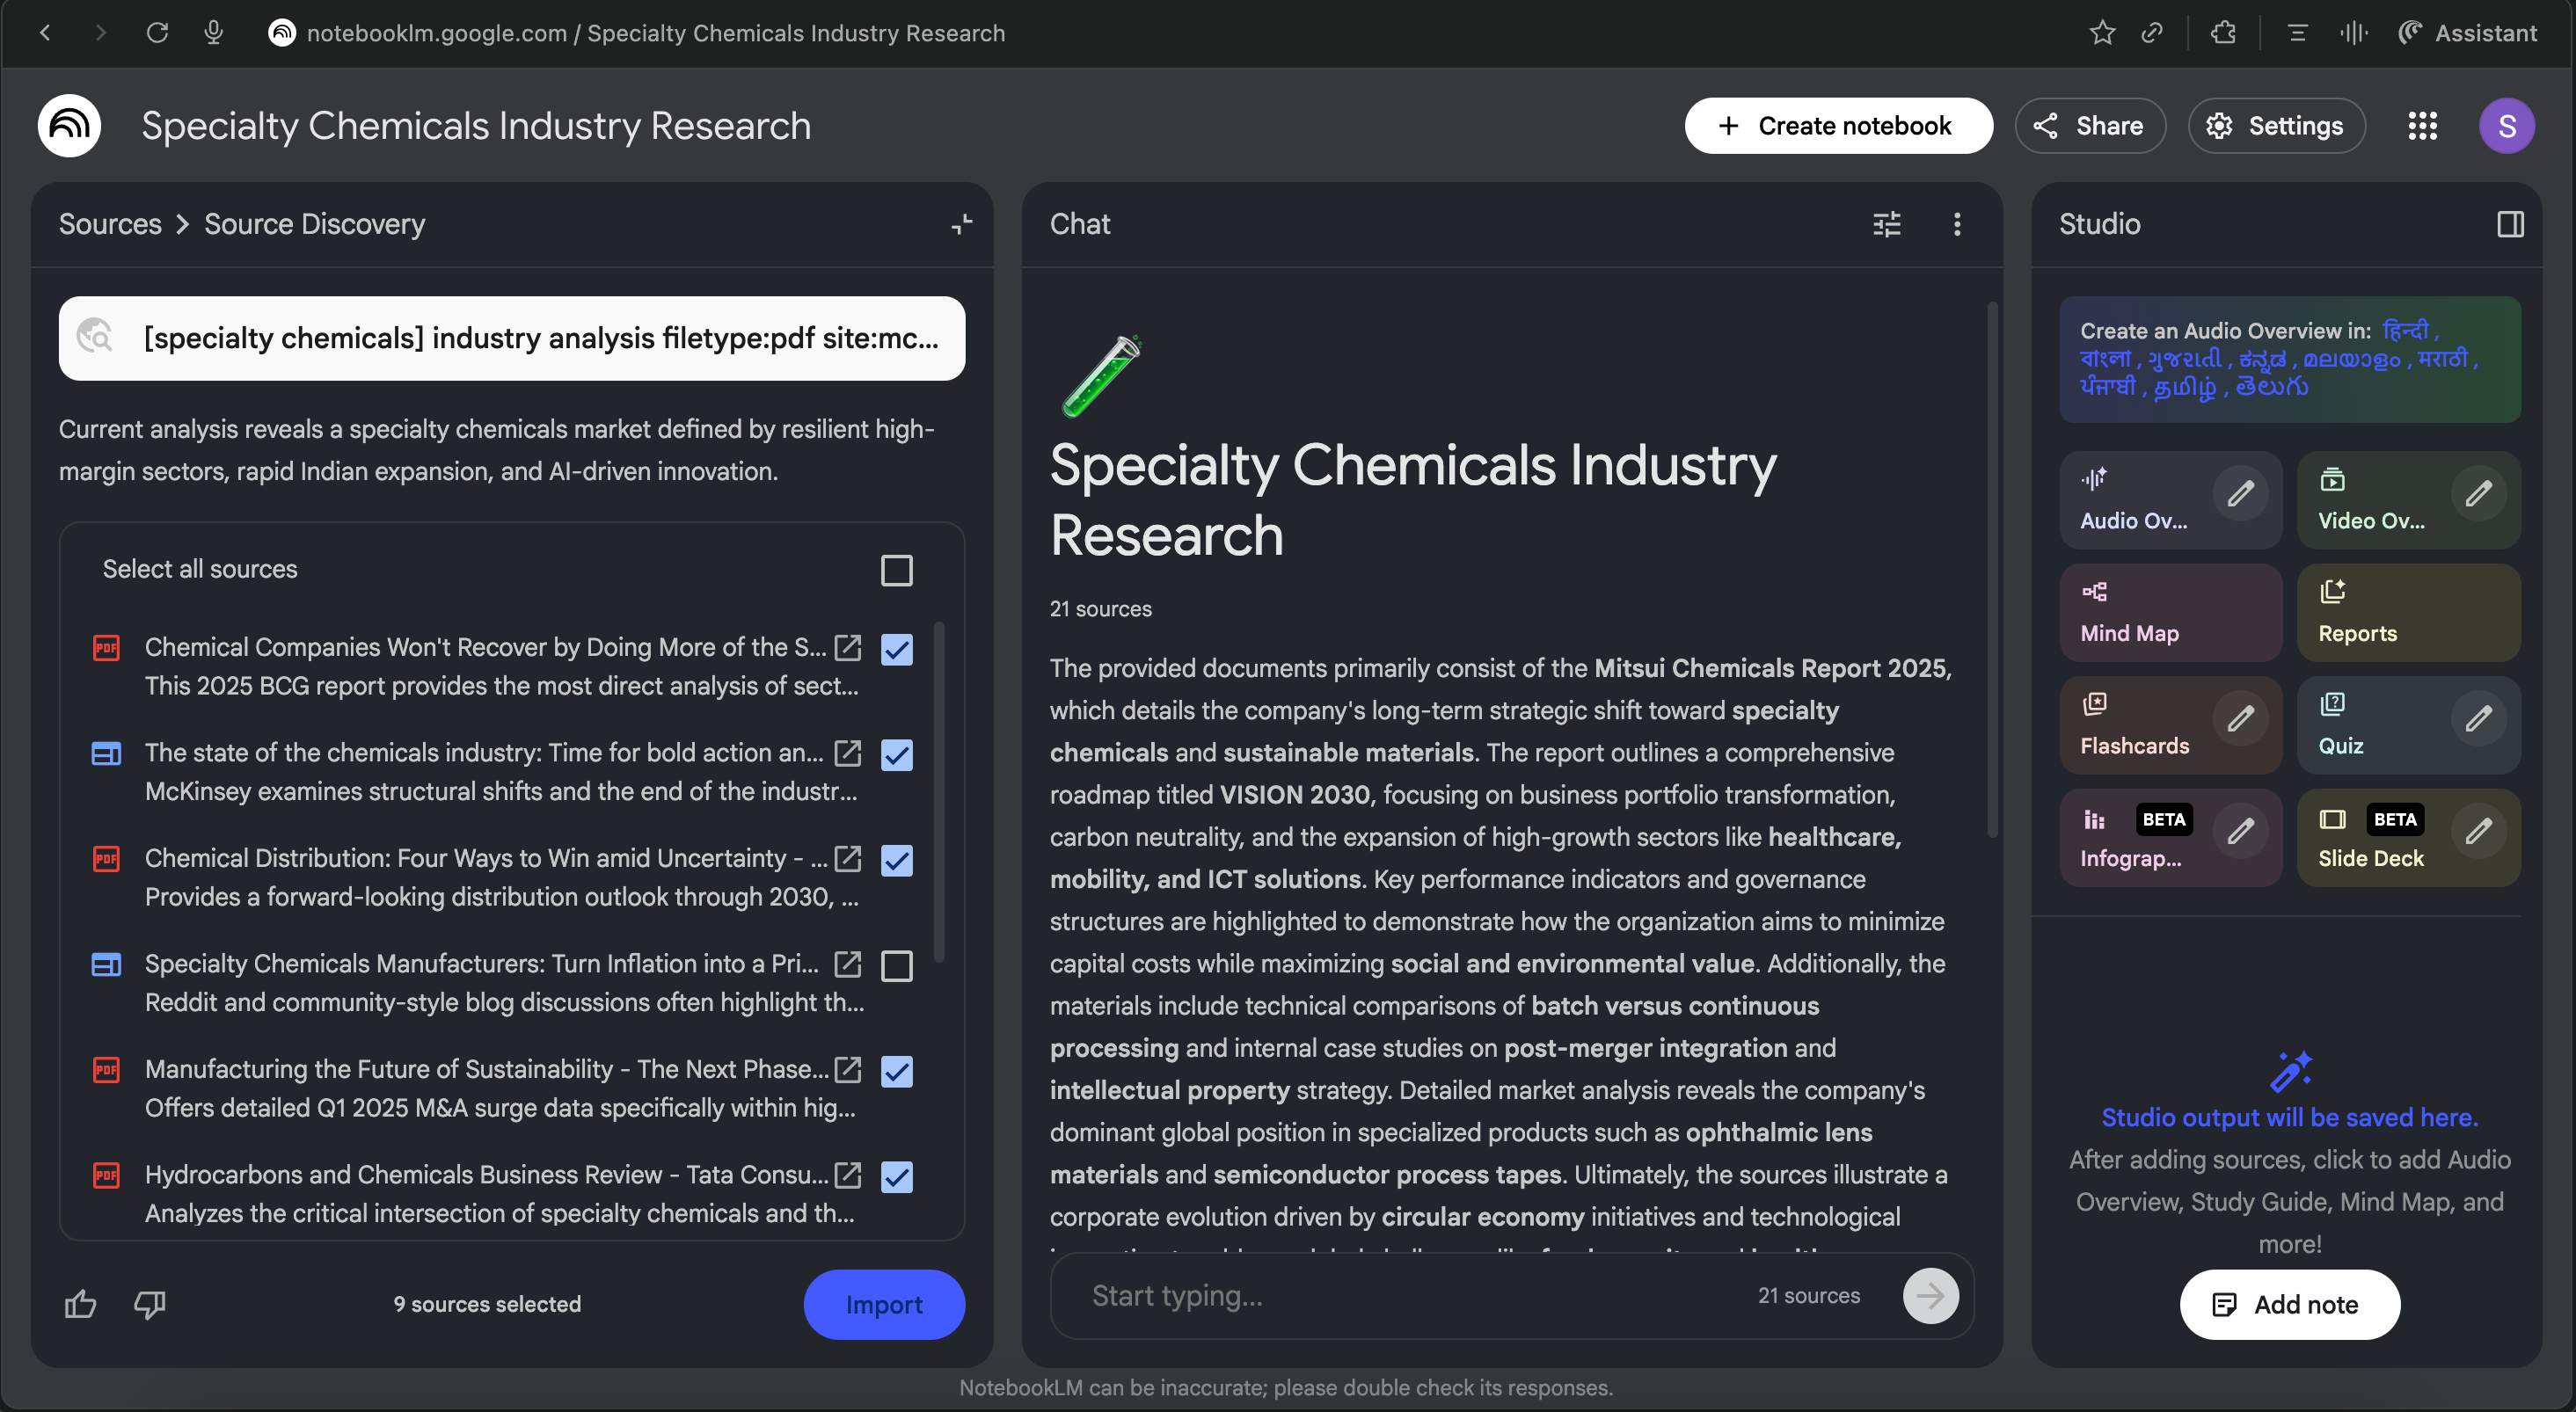
For consultancy and research reports:
[Industry Name] industry analysis filetype:pdf site:mckinsey.com OR site:deloitte.com OR site:ey.com OR site:bcg.com OR site:bain.com after:2024
[Industry Name] market outlook 2025 filetype:pdf site:kpmg.com OR site:pwc.com
For government and regulatory body reports:
[Industry Name] policy report filetype:pdf site:gov.in OR site:nic.in after:2023
For global industries:
[Industry Name] industry report filetype:pdf site:unido.org OR site:oecd.org OR site:worldbank.org
For industry association publications:
[Industry Name] association annual report 2024 filetype:pdf
[Industry Name] industry body white paper market size
For recent data and trends:
[Industry Name] market size growth 2025 after:2024-06-01
Review what NotebookLM returns. Uncheck generic news articles or low-quality sources. Select the substantive reports, the ones with actual data, frameworks, and analysis. Add them to your notebook.
Step 4: Fill Gaps with Deep Research
If Discover Sources doesn’t surface what you need, especially for niche industries or specialized regulatory bodies, use NotebookLM’s Deep Research feature.
Unlike Discover Sources (which returns 10 quick results), Deep Research spends 3-5 minutes browsing hundreds of websites and compiles a comprehensive report with 15-25 cited sources.
Use prompts like:
Find recent industry reports, regulatory filings, and policy documents for [Industry Name] in [Country/Region]. Focus on market size data, growth projections, and regulatory frameworks published after January 2024.
Identify official publications from [Specific Regulatory Body or Industry Association] related to [Industry Name] sector analysis, annual reviews, or market outlook reports.
Deep Research will return both a synthesised report and a list of sources (cited and uncited). Import the report and cherry-pick the highest-quality sources.
Step 5: Manual Sourcing for Stubborn Gaps
Sometimes, especially for niche industries, AI-powered discovery misses important sources. Government ministry reports, obscure industry association publications, or regional regulatory body documents often don’t surface automatically.
When this happens, go to Google directly and use these search patterns:
For Indian government and ministry reports:
site:ibef.org [Industry Name] report filetype:pdf
site:makeinindia.com [Industry Name]
site:pib.gov.in [Industry Name] policy
[Industry Ministry Name] annual report filetype:pdf
For industry associations (when you know the name):
site:[association-website] annual report OR market outlook filetype:pdf
For CRISIL/ICRA/FICCI commissioned research:
[Industry Name] CRISIL report filetype:pdf after:2023
[Industry Name] FICCI study filetype:pdf
For global equivalents:
site:trade.gov [Industry Name] market overview (US International Trade Administration)
site:ec.europa.eu [Industry Name] industry report (European Commission)
Once you find these sources, download the PDFs and upload them directly to your NotebookLM notebook.
Managing Your 50-Source Limit (on free plan)
By now, you might have:
3 foundational Gemini Deep Research reports
5-7 company annual reports
10-15 discovered/researched sources (consultancy reports, regulatory documents)
5-10 manually sourced niche publications
That’s 25-35 sources, leaving room for ongoing additions as you deepen your research.
Quality matters more than quantity. A notebook with 30 carefully selected sources will outperform one stuffed with 50 mediocre ones. Be ruthless about what you include.
Pro Tip: Add Primary Research Through Earnings Calls
Everything we’ve discussed so far, consultancy reports, government publications, annual reports, is secondary research. Valuable, but filtered.
There’s one source type that gets you closer to primary research: earnings call transcripts.
These are unscripted conversations between professional analysts and company management. The analysts ask pointed questions about industry headwinds, competitive dynamics, pricing pressure, supply chain risks. The management responds in real-time and their tone, confidence, and hesitation reveal things no polished annual report ever will.
When a specialty chemicals CEO discusses China+1 tailwinds or feedstock pricing volatility, they’re not just talking about their company. They’re giving you a window into the entire industry.
How to do this:
Identify 3-4 leadership companies across the value chain: one from upstream (raw materials/suppliers), one from the core industry (manufacturers), one from downstream (distributors or end-users). Don’t worry about finding “good management”, just pick the market leaders in each segment. Leaders see the industry most clearly because they shape it.
Download recent earnings call transcripts: For Indian companies, go to Screener.in and download con call transcripts directly from company pages. For US and global companies, use Finviz or the company’s investor relations website.
Summarize them into one industry-level report: Upload all transcripts to Gemini and use a simple prompt:
Summarize these earnings call transcripts into a single industry analysis report. Focus on: industry outlook, competitive dynamics, supply chain commentary, pricing trends, regulatory concerns, and management sentiment. Highlight where multiple managements agree or disagree.
Upload the synthesis to your notebook: Export Gemini’s output as a PDF and add it to NotebookLM. One source slot. High-value primary research synthesis.
This is as close as a retail investor gets to sitting in a room with industry insiders. Use it.
Building Your Notebook
You have the framework. You have the prompts. You have the source discovery strategy.
Now let’s put it all together.
This section is a step-by-step walkthrough of building an industry research notebook from scratch. I’ll use Indian Specialty Chemicals as the running example, but the process is identical for any industry, any geography.
Step 1: Create Your Notebook
Go to notebooklm.google.com and click “New Notebook.”
Name it clearly. I use a format like:
Industry Research: Indian Specialty ChemicalsIndustry Research: European AutomotiveIndustry Research: US Data Centers
The naming convention matters when you’re managing multiple notebooks. You’ll thank yourself later.
Step 2: Generate Your Foundation Reports
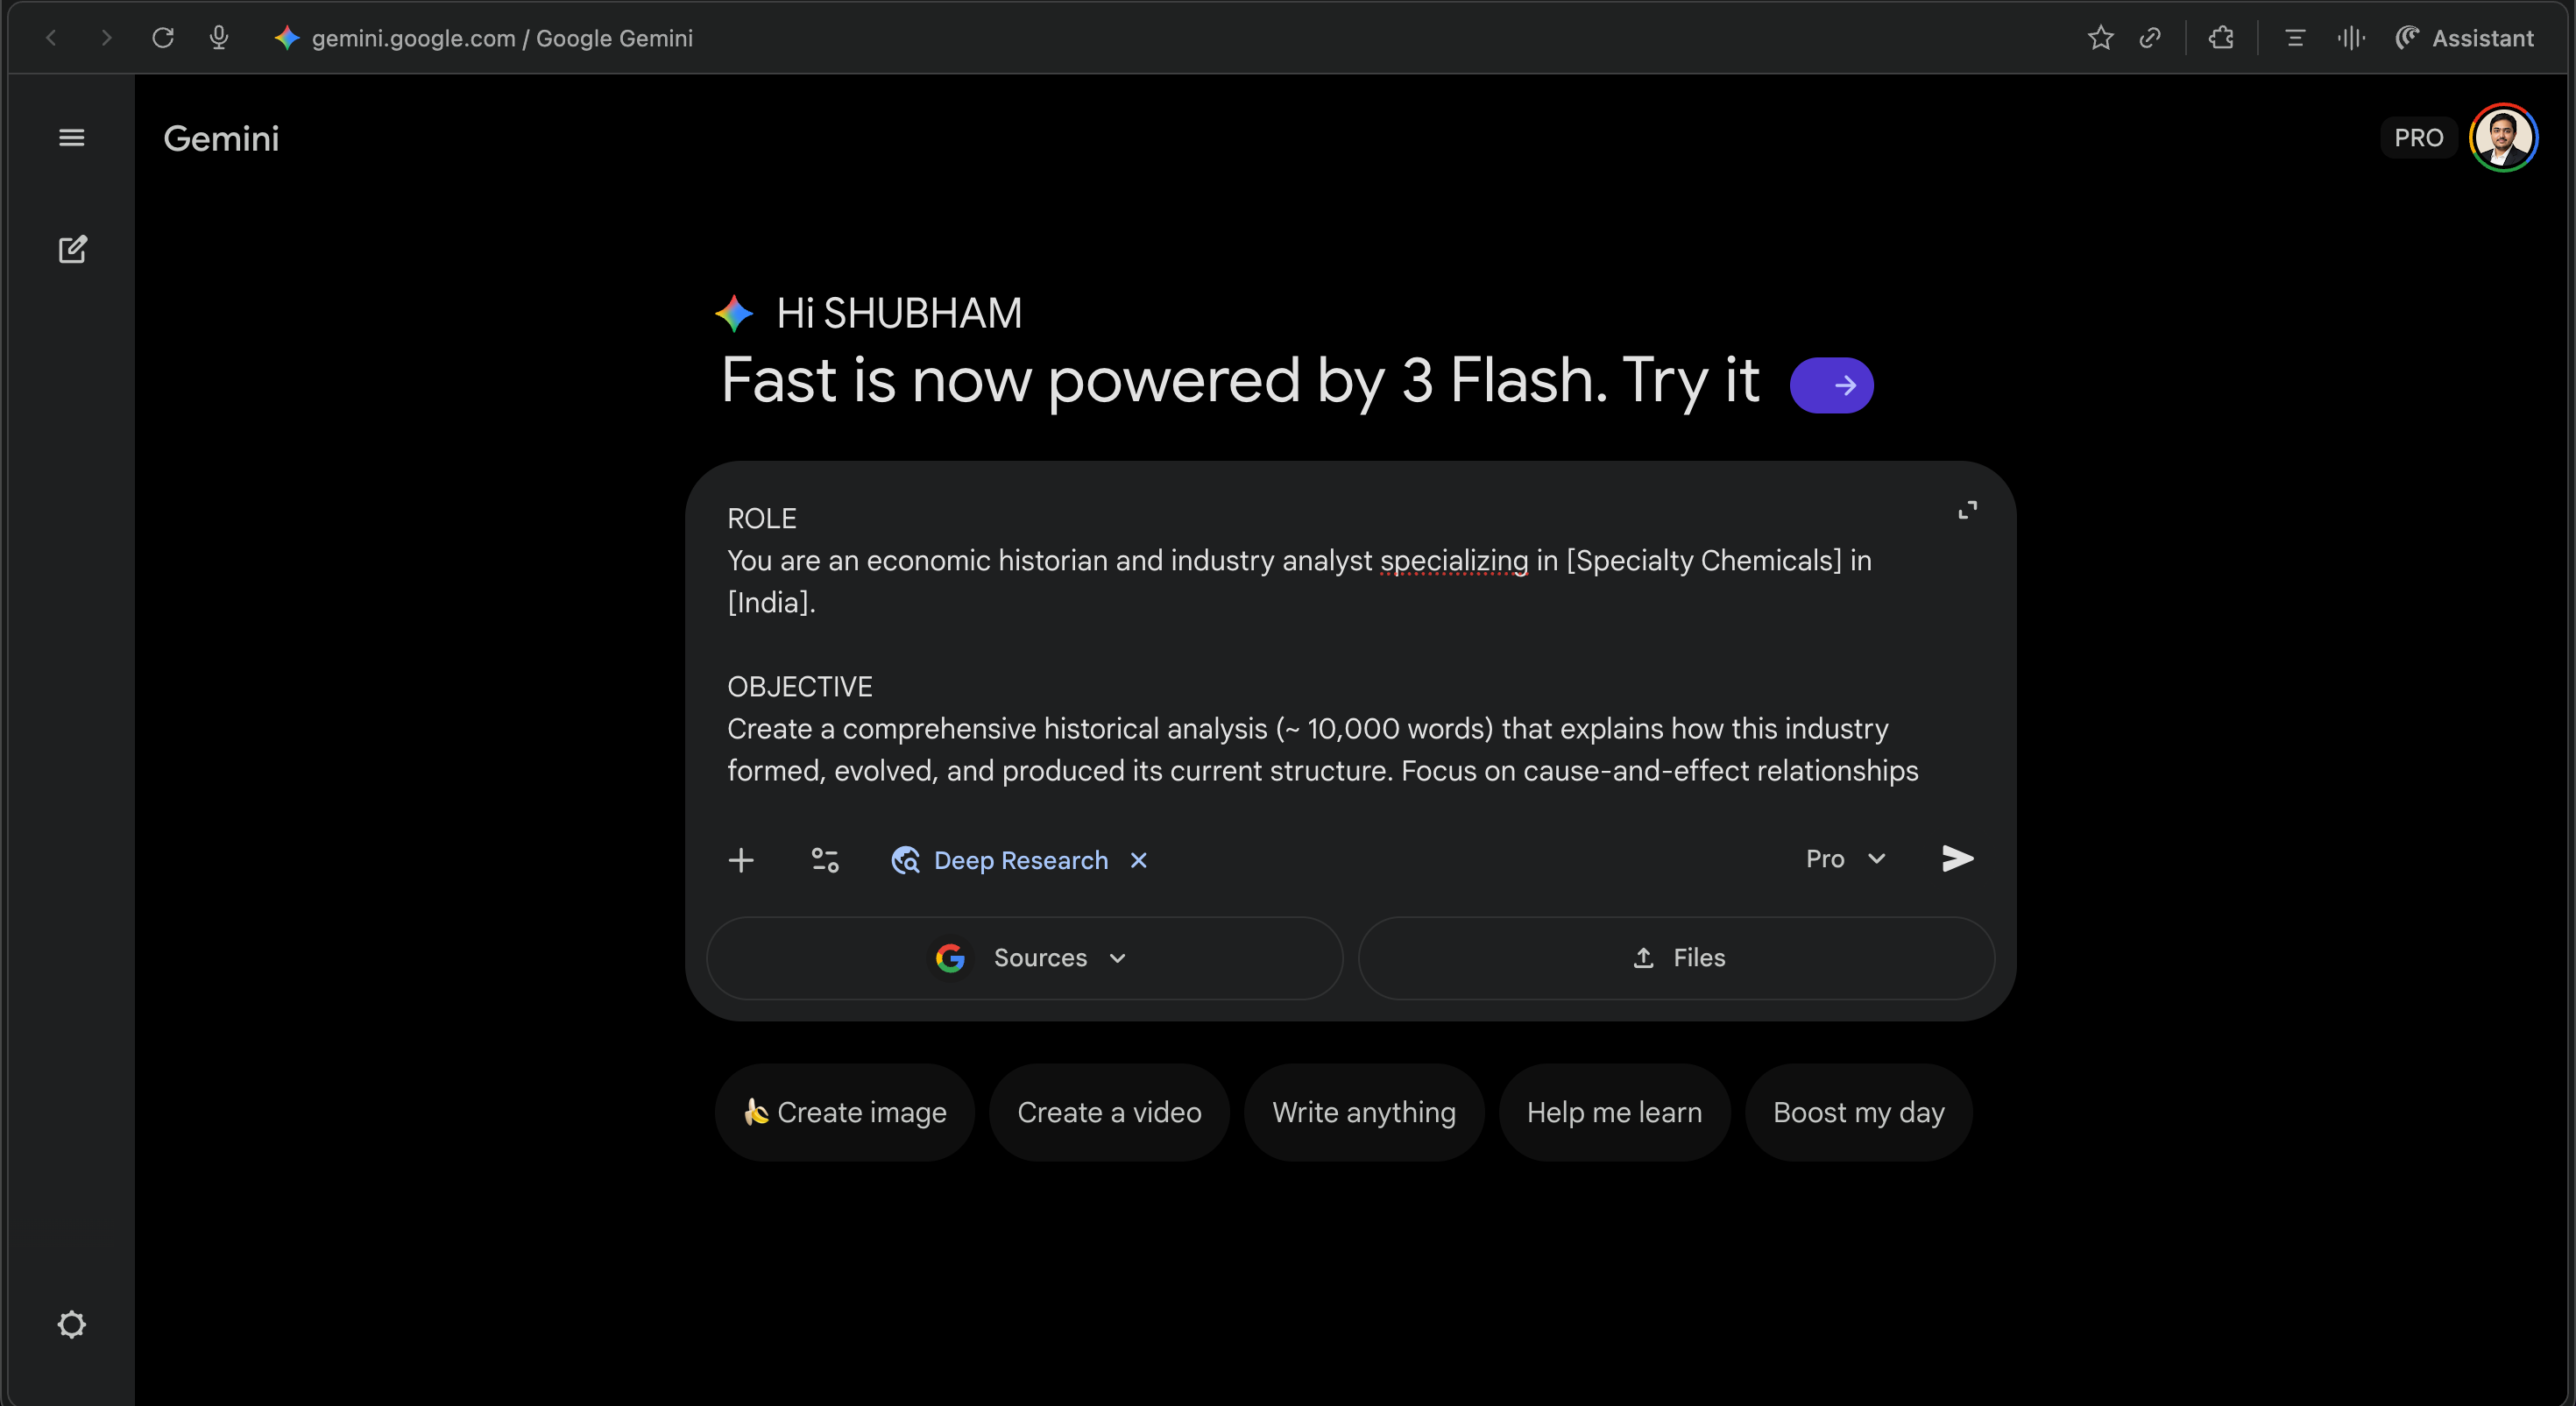
Open Gemini (gemini.google.com) in a separate tab. Select Deep Research mode.
Run the three prompts we covered earlier: Origin, Trajectory, and Engine, one at a time. For Indian Specialty Chemicals, my prompt inputs looked like:
Industry Origin:
[Industry Name]→ Indian Specialty Chemicals,[Country/Region]→ IndiaIndustry Trajectory: Same substitution
Industry Engine: Same substitution
Each report takes 3-5 minutes. Let them run in the background.
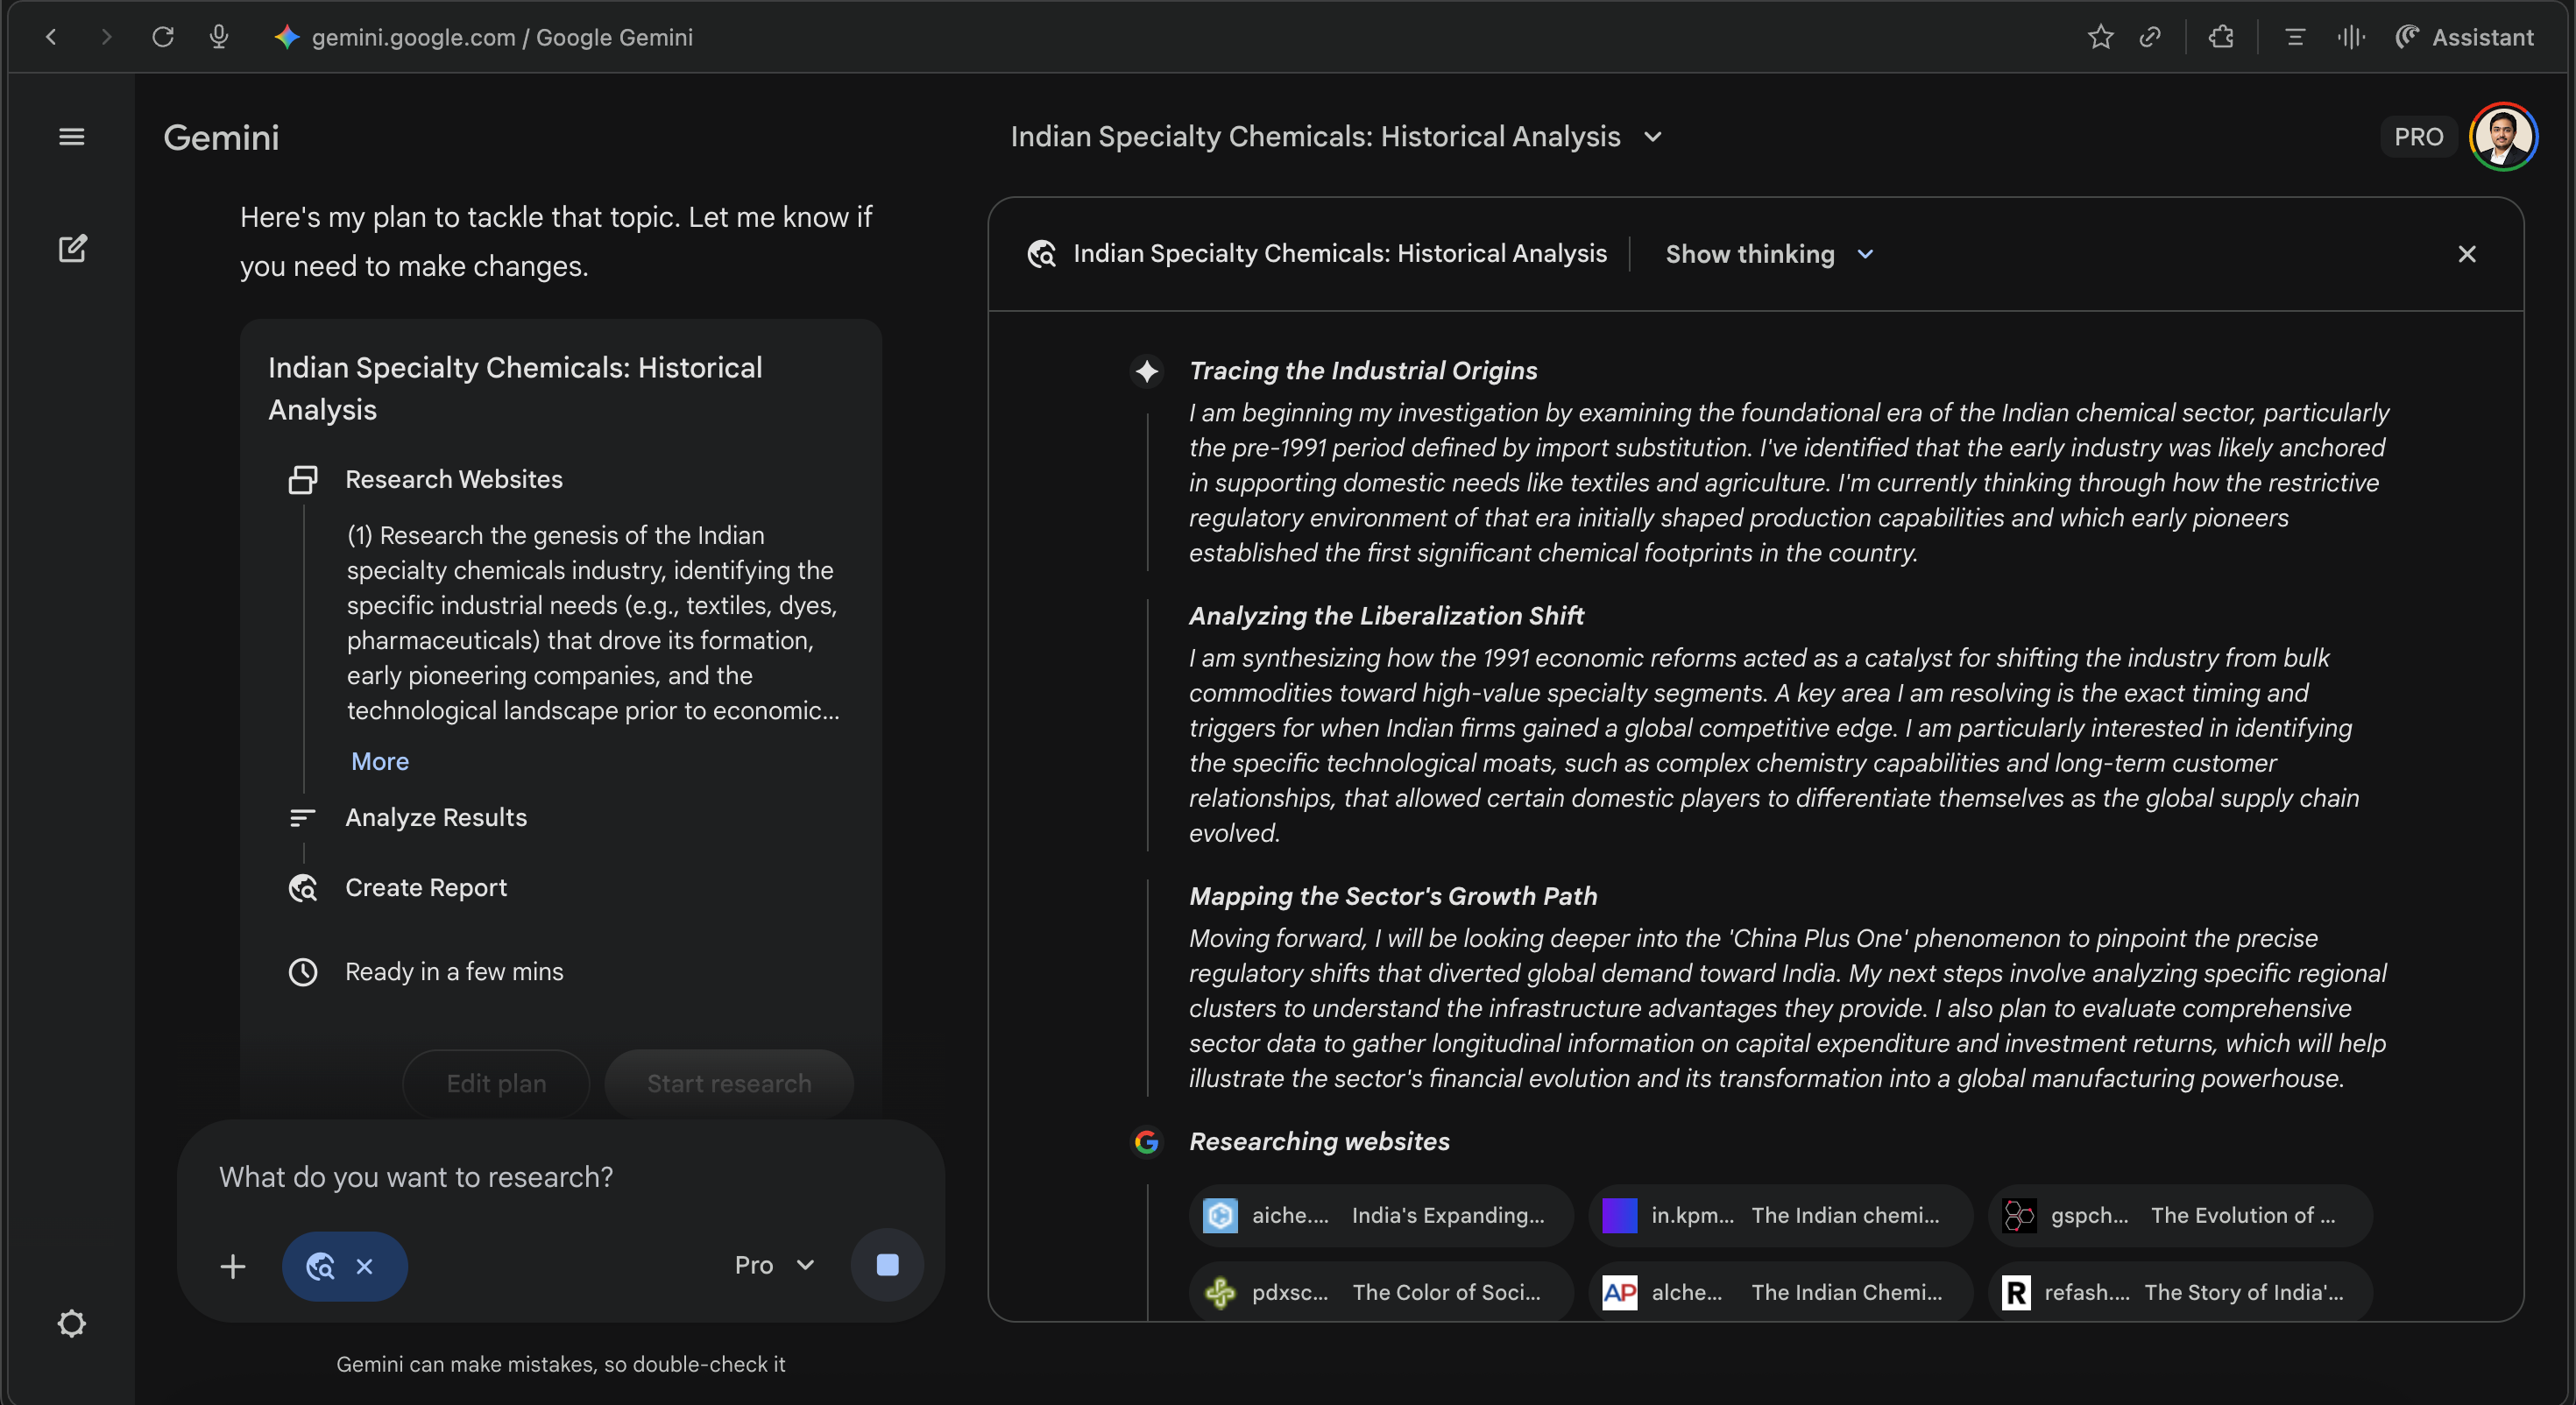
Once complete, export each as a google doc. You now have three comprehensive reports, probably 8,000-10,000 words each, synthesised from hundreds of web sources.
Step 3: Import Foundation + Annual Reports
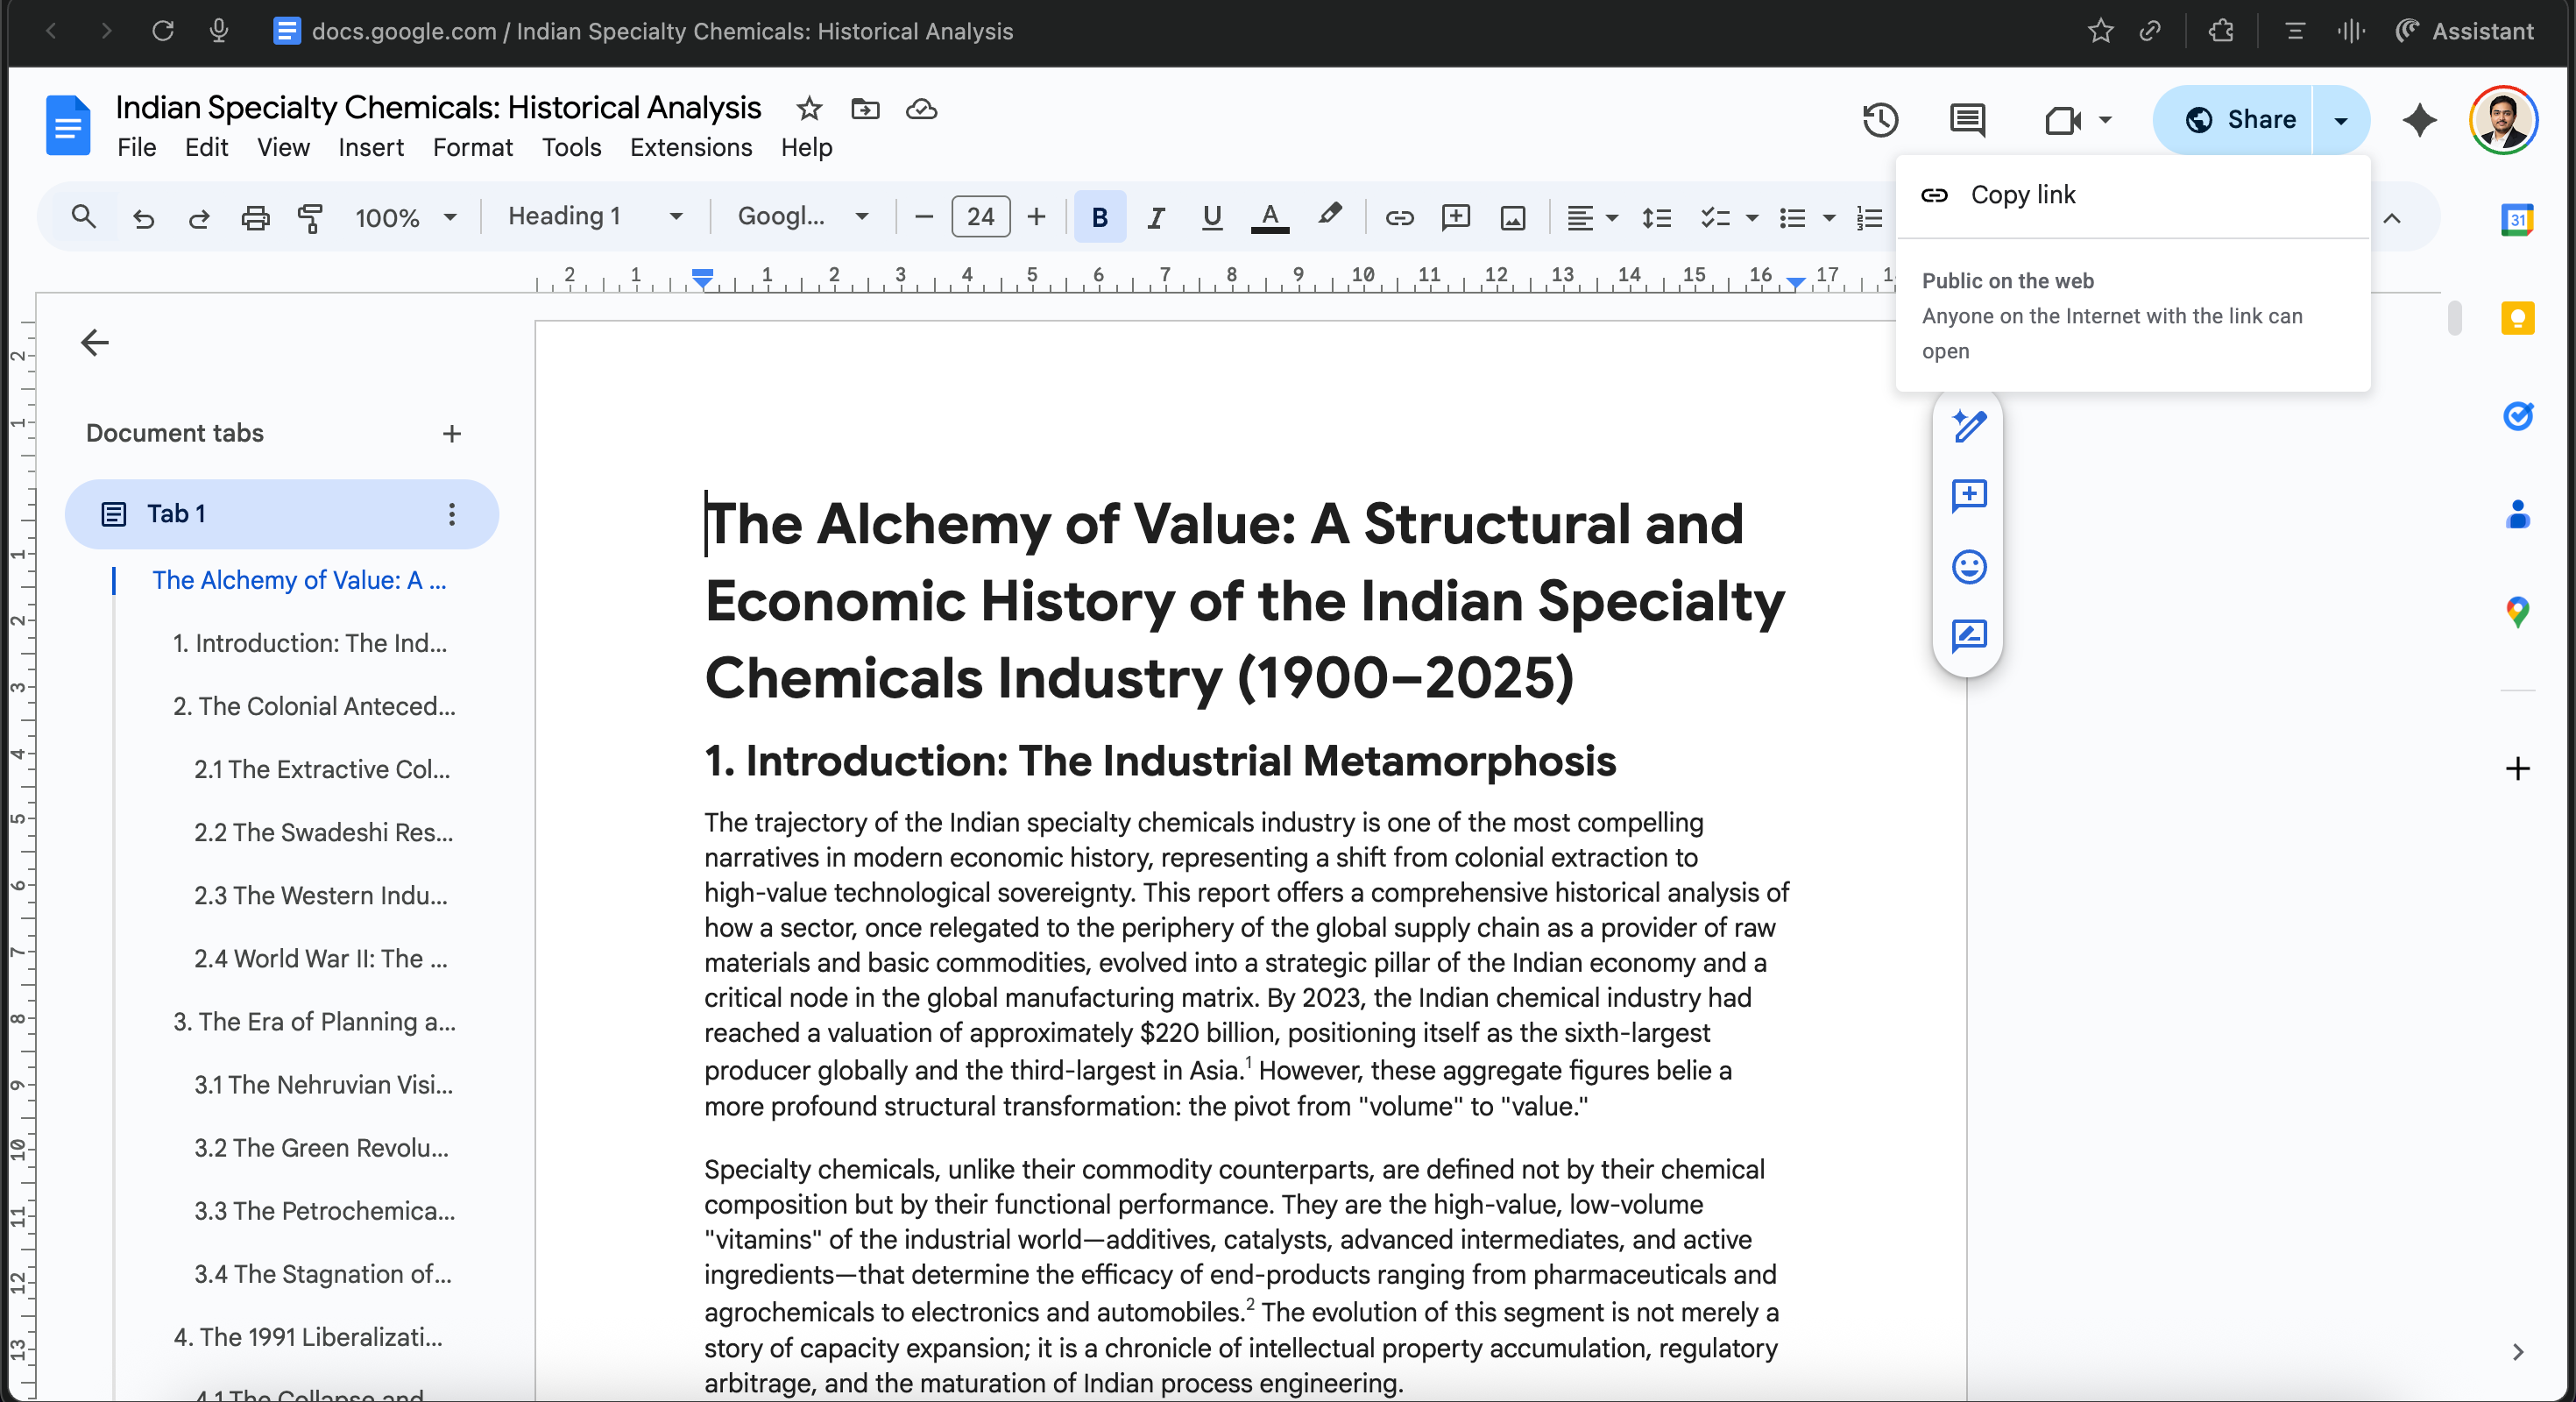
Upload your three Gemini docs to the notebook.(or simply add the doc link)
Then add 5-7 annual report from companies across the industry.
For Indian Specialty Chemicals, I selected:
Diversified players: Deepak Nitrite (basic + specialty + phenolics), SRF (fluorochemicals + specialty chemicals)
Core specialty manufacturers: Aarti Industries, Navin Fluorine, Vinati Organics
Application-focused: PI Industries (agrochemical contract manufacturing)
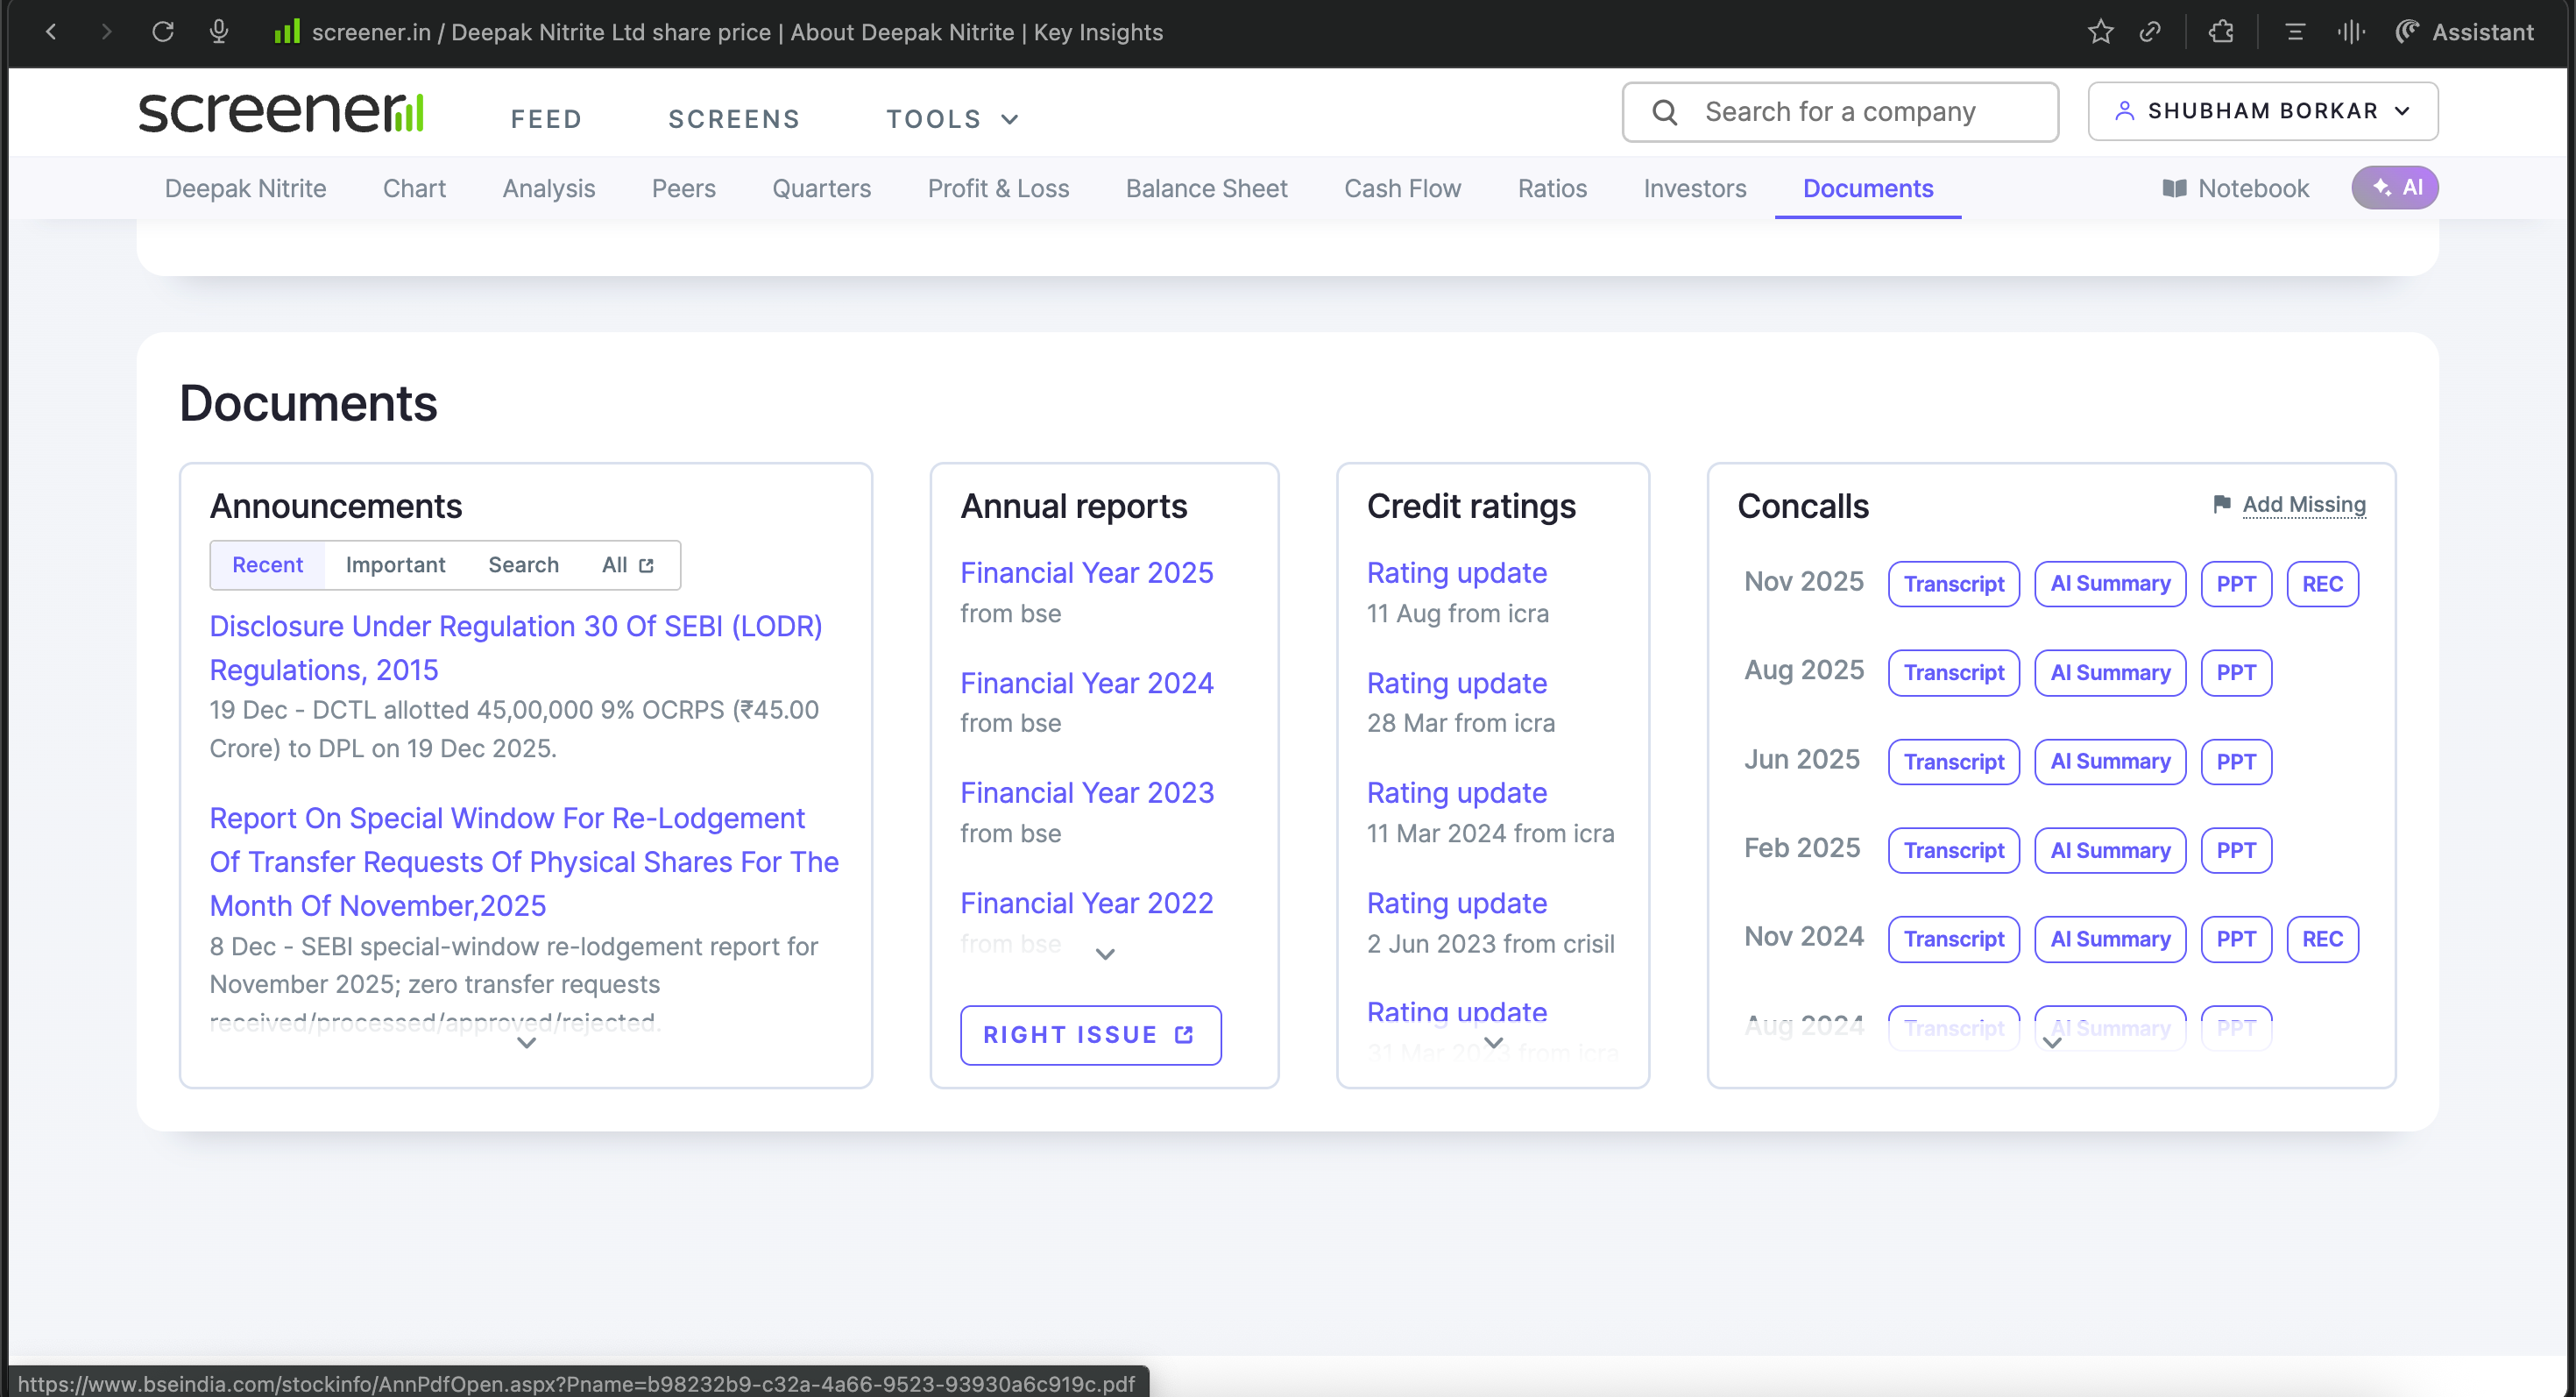
The goal is coverage across different chemistries, end-markets, and business models, not a strict supply chain sequence.
You’ve now used about 10 source slots.
Step 4: Discover Additional Sources
Use NotebookLM’s Discover Sources feature to find consultancy and regulatory reports.(Alternatively use Google search)
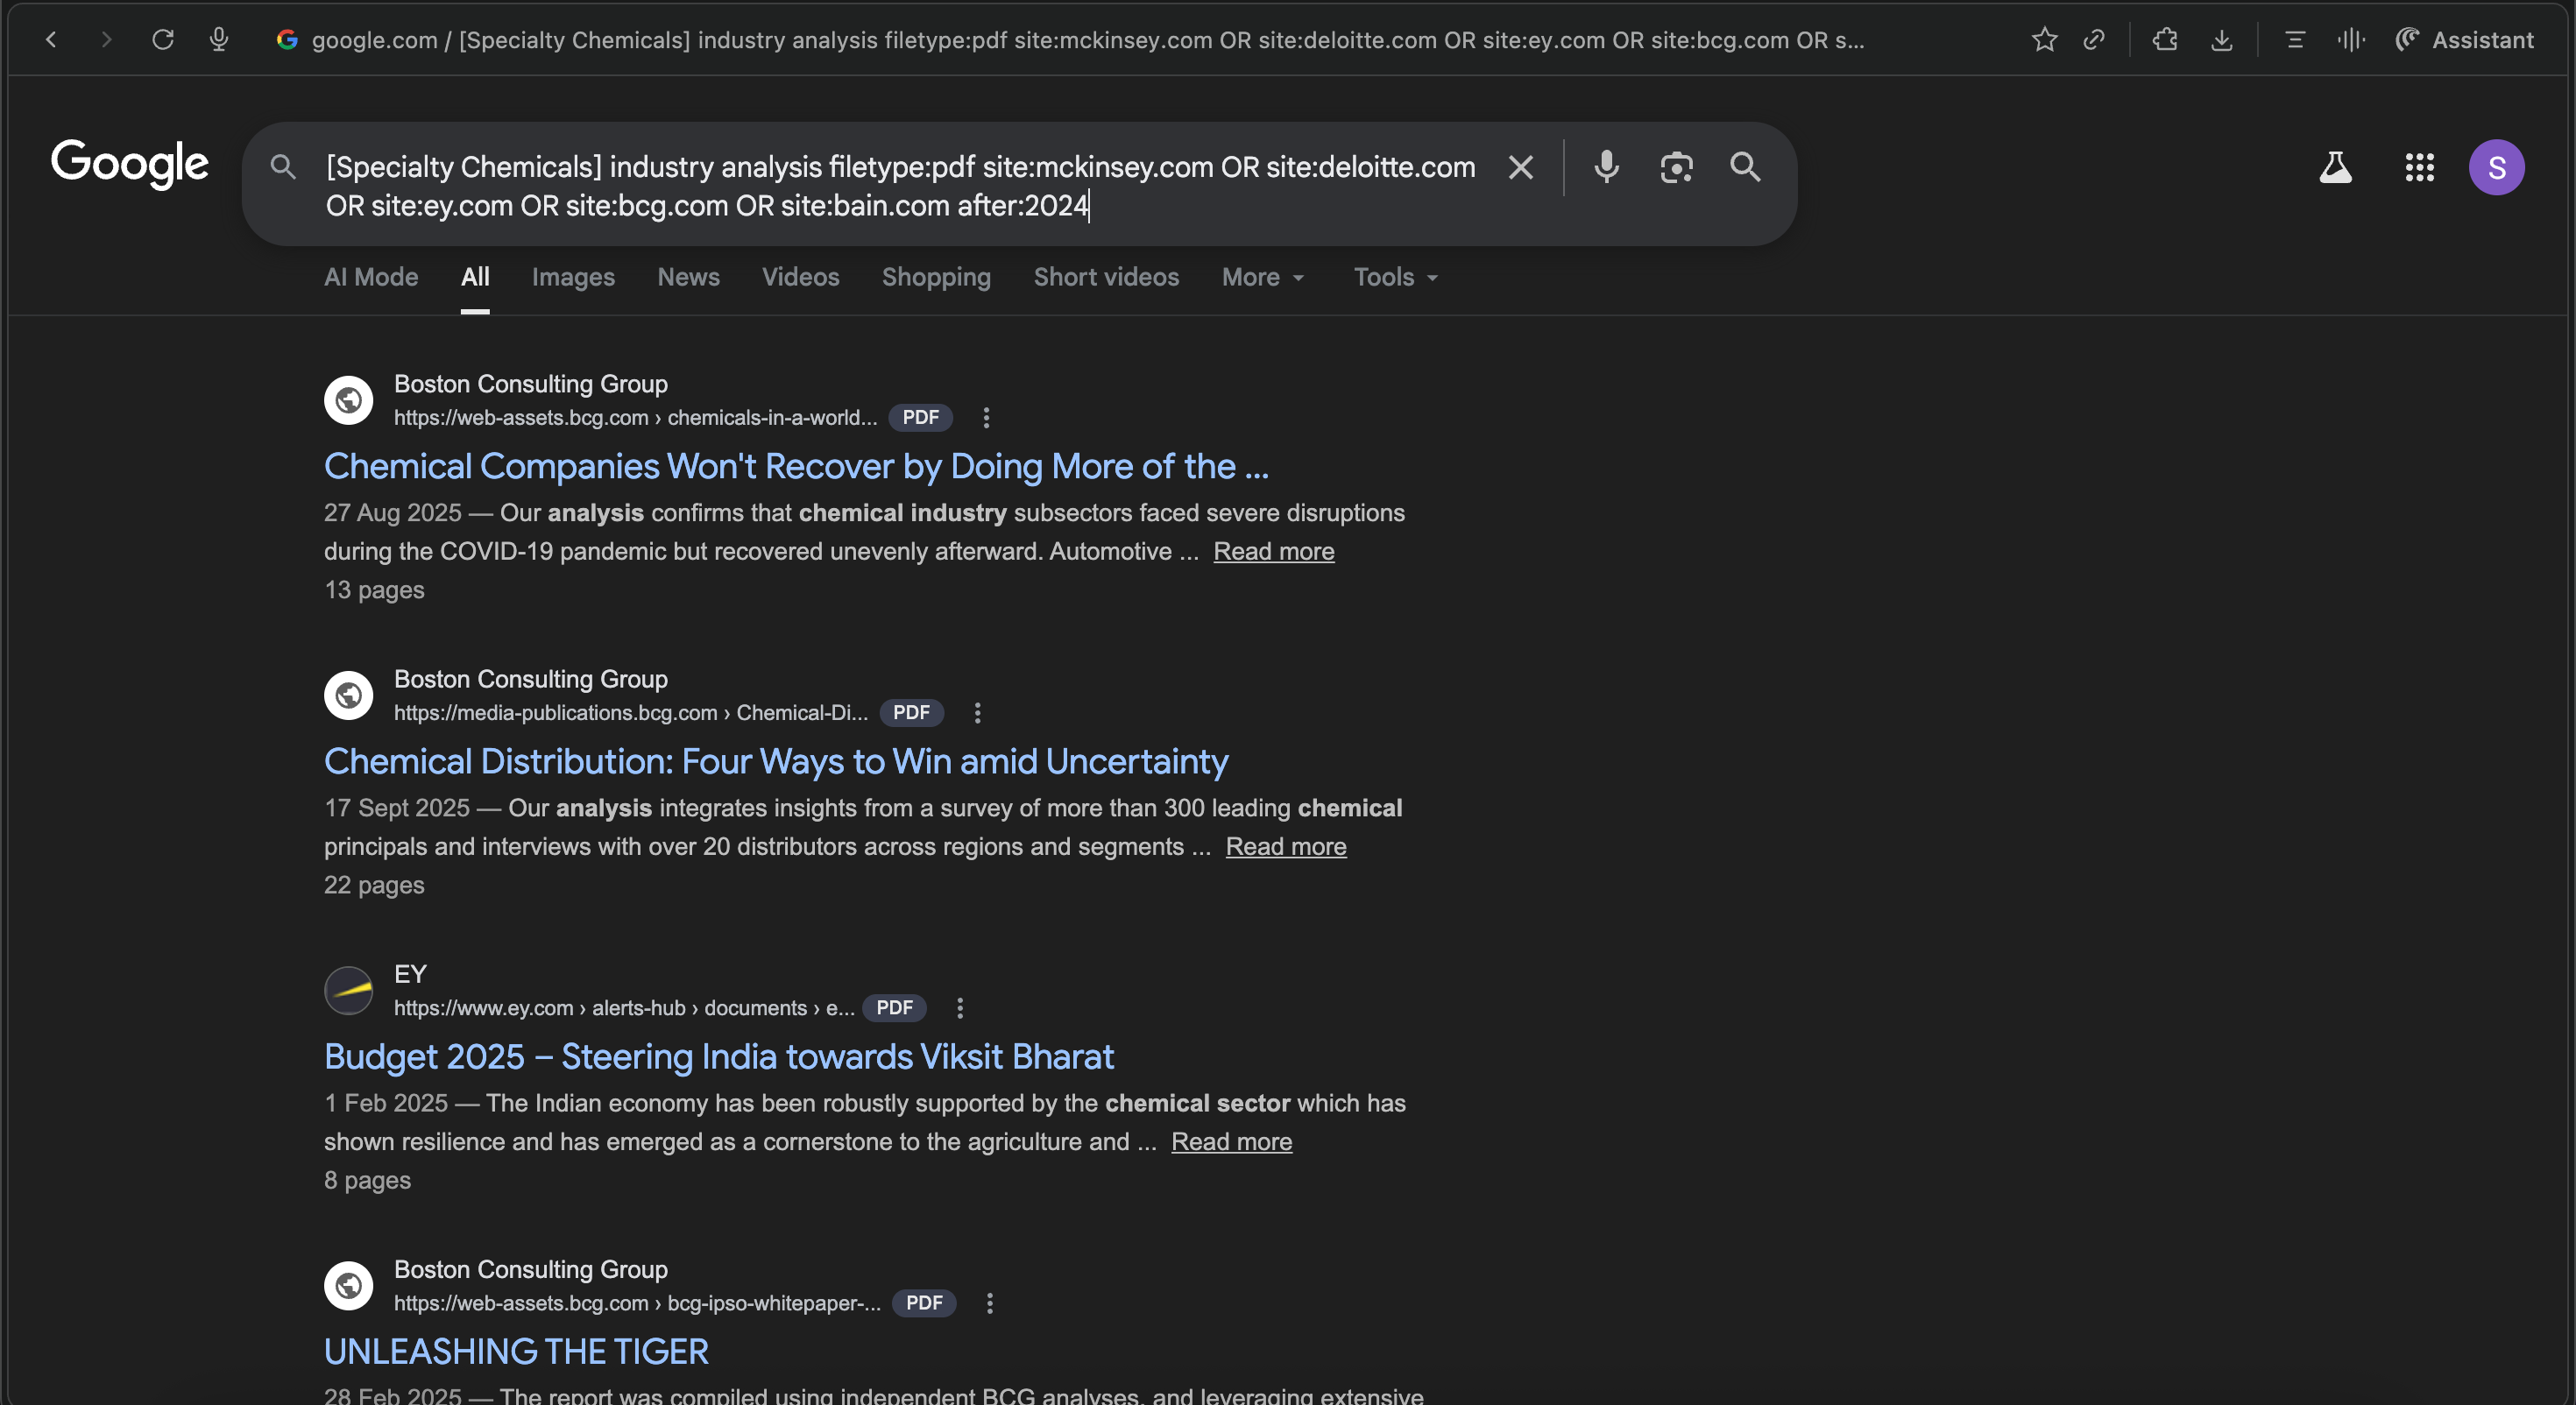
Run targeted prompts like:
specialty chemicals India industry analysis filetype:pdf site:mckinsey.com OR site:deloitte.com OR site:ey.com after:2024
specialty chemicals India policy report filetype:pdf site:gov.in OR site:ibef.org
Indian chemical industry market outlook 2025 filetype:pdf
Review what surfaces. Select the substantive reports, skip news articles and generic overviews. Import them.
Step 5: Run Deep Research for Gaps