

How I used Claude Cowork to write a full equity research report in 90 minutes.
Most analysts are still spending 3 days doing something Claude Cowork finishes in an afternoon. This is the workflow.

People who do equity research are not lazy. They are some of the most detail-oriented professionals in finance. They read annual reports for fun. They build models on weekends. They argue about EV/EBITDA multiples at dinner. The work is not the problem. But the process has a ceiling. If one research report takes you three days, you cover two companies a month. That is the ceiling. Not your skill. Not your effort. Time. And if you could do the same quality work in 90 minutes, you would not stop doing research. You would do ten times more of it.
This is not about doing less. It is about doing more.
Most conversations about AI in finance frame it as a replacement. Faster, cheaper, fewer analysts. That is the wrong frame entirely. The best researchers are not going to stop doing research because a tool speeds them up. They are going to do more of it. Better coverage. More companies. Sharper theses. Efficiency does not kill the craft. It expands it. The analyst who covers ten companies with the same effort that used to cover two is not doing less work. They are doing the work that actually matters, ten times over.
This is the Claude Cowork workflow that built the report. Let me walk you through it.
Step 1: Download Claude app and install the Equity Research Plugin.
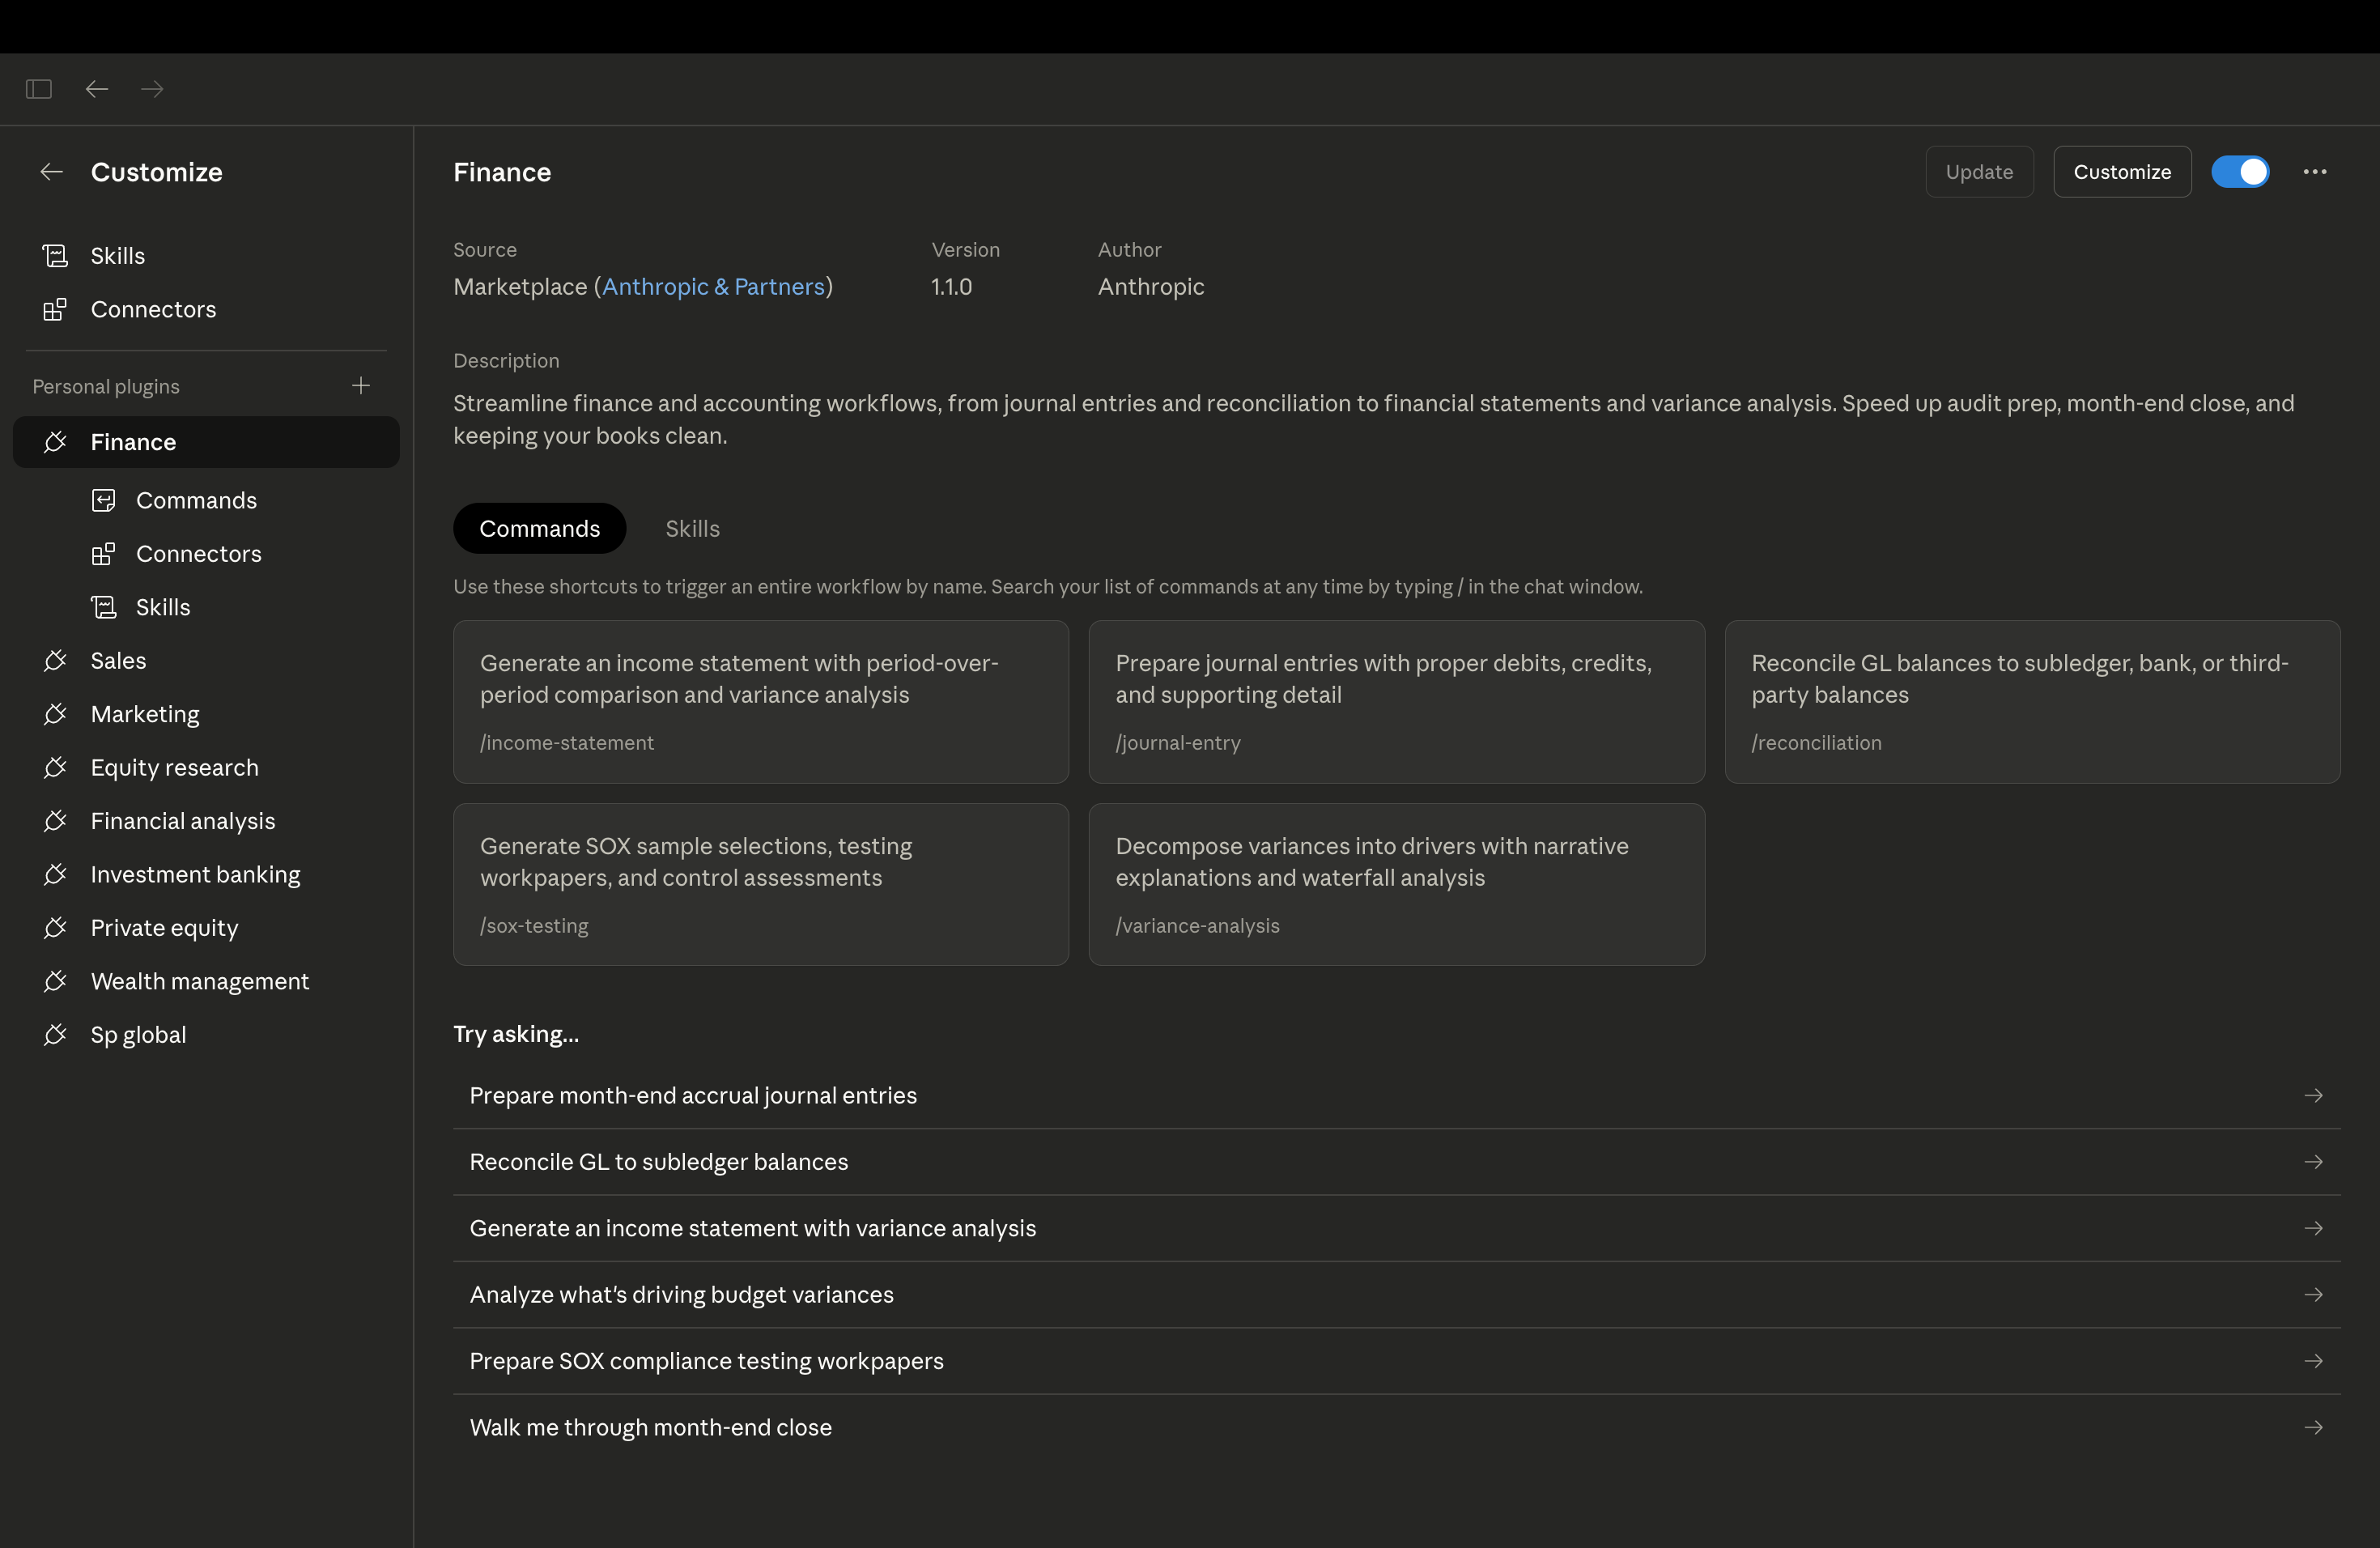
Go to claude.ai and download the Claude desktop app. Switch to Claude Cowork section. Once it is open, search for the Equity Research Plugin in the plugin library, or go directly to claude.com/plugins/equity-research. Install it. That is it. The whole setup takes under ten minutes and you do not need to touch a single line of code.
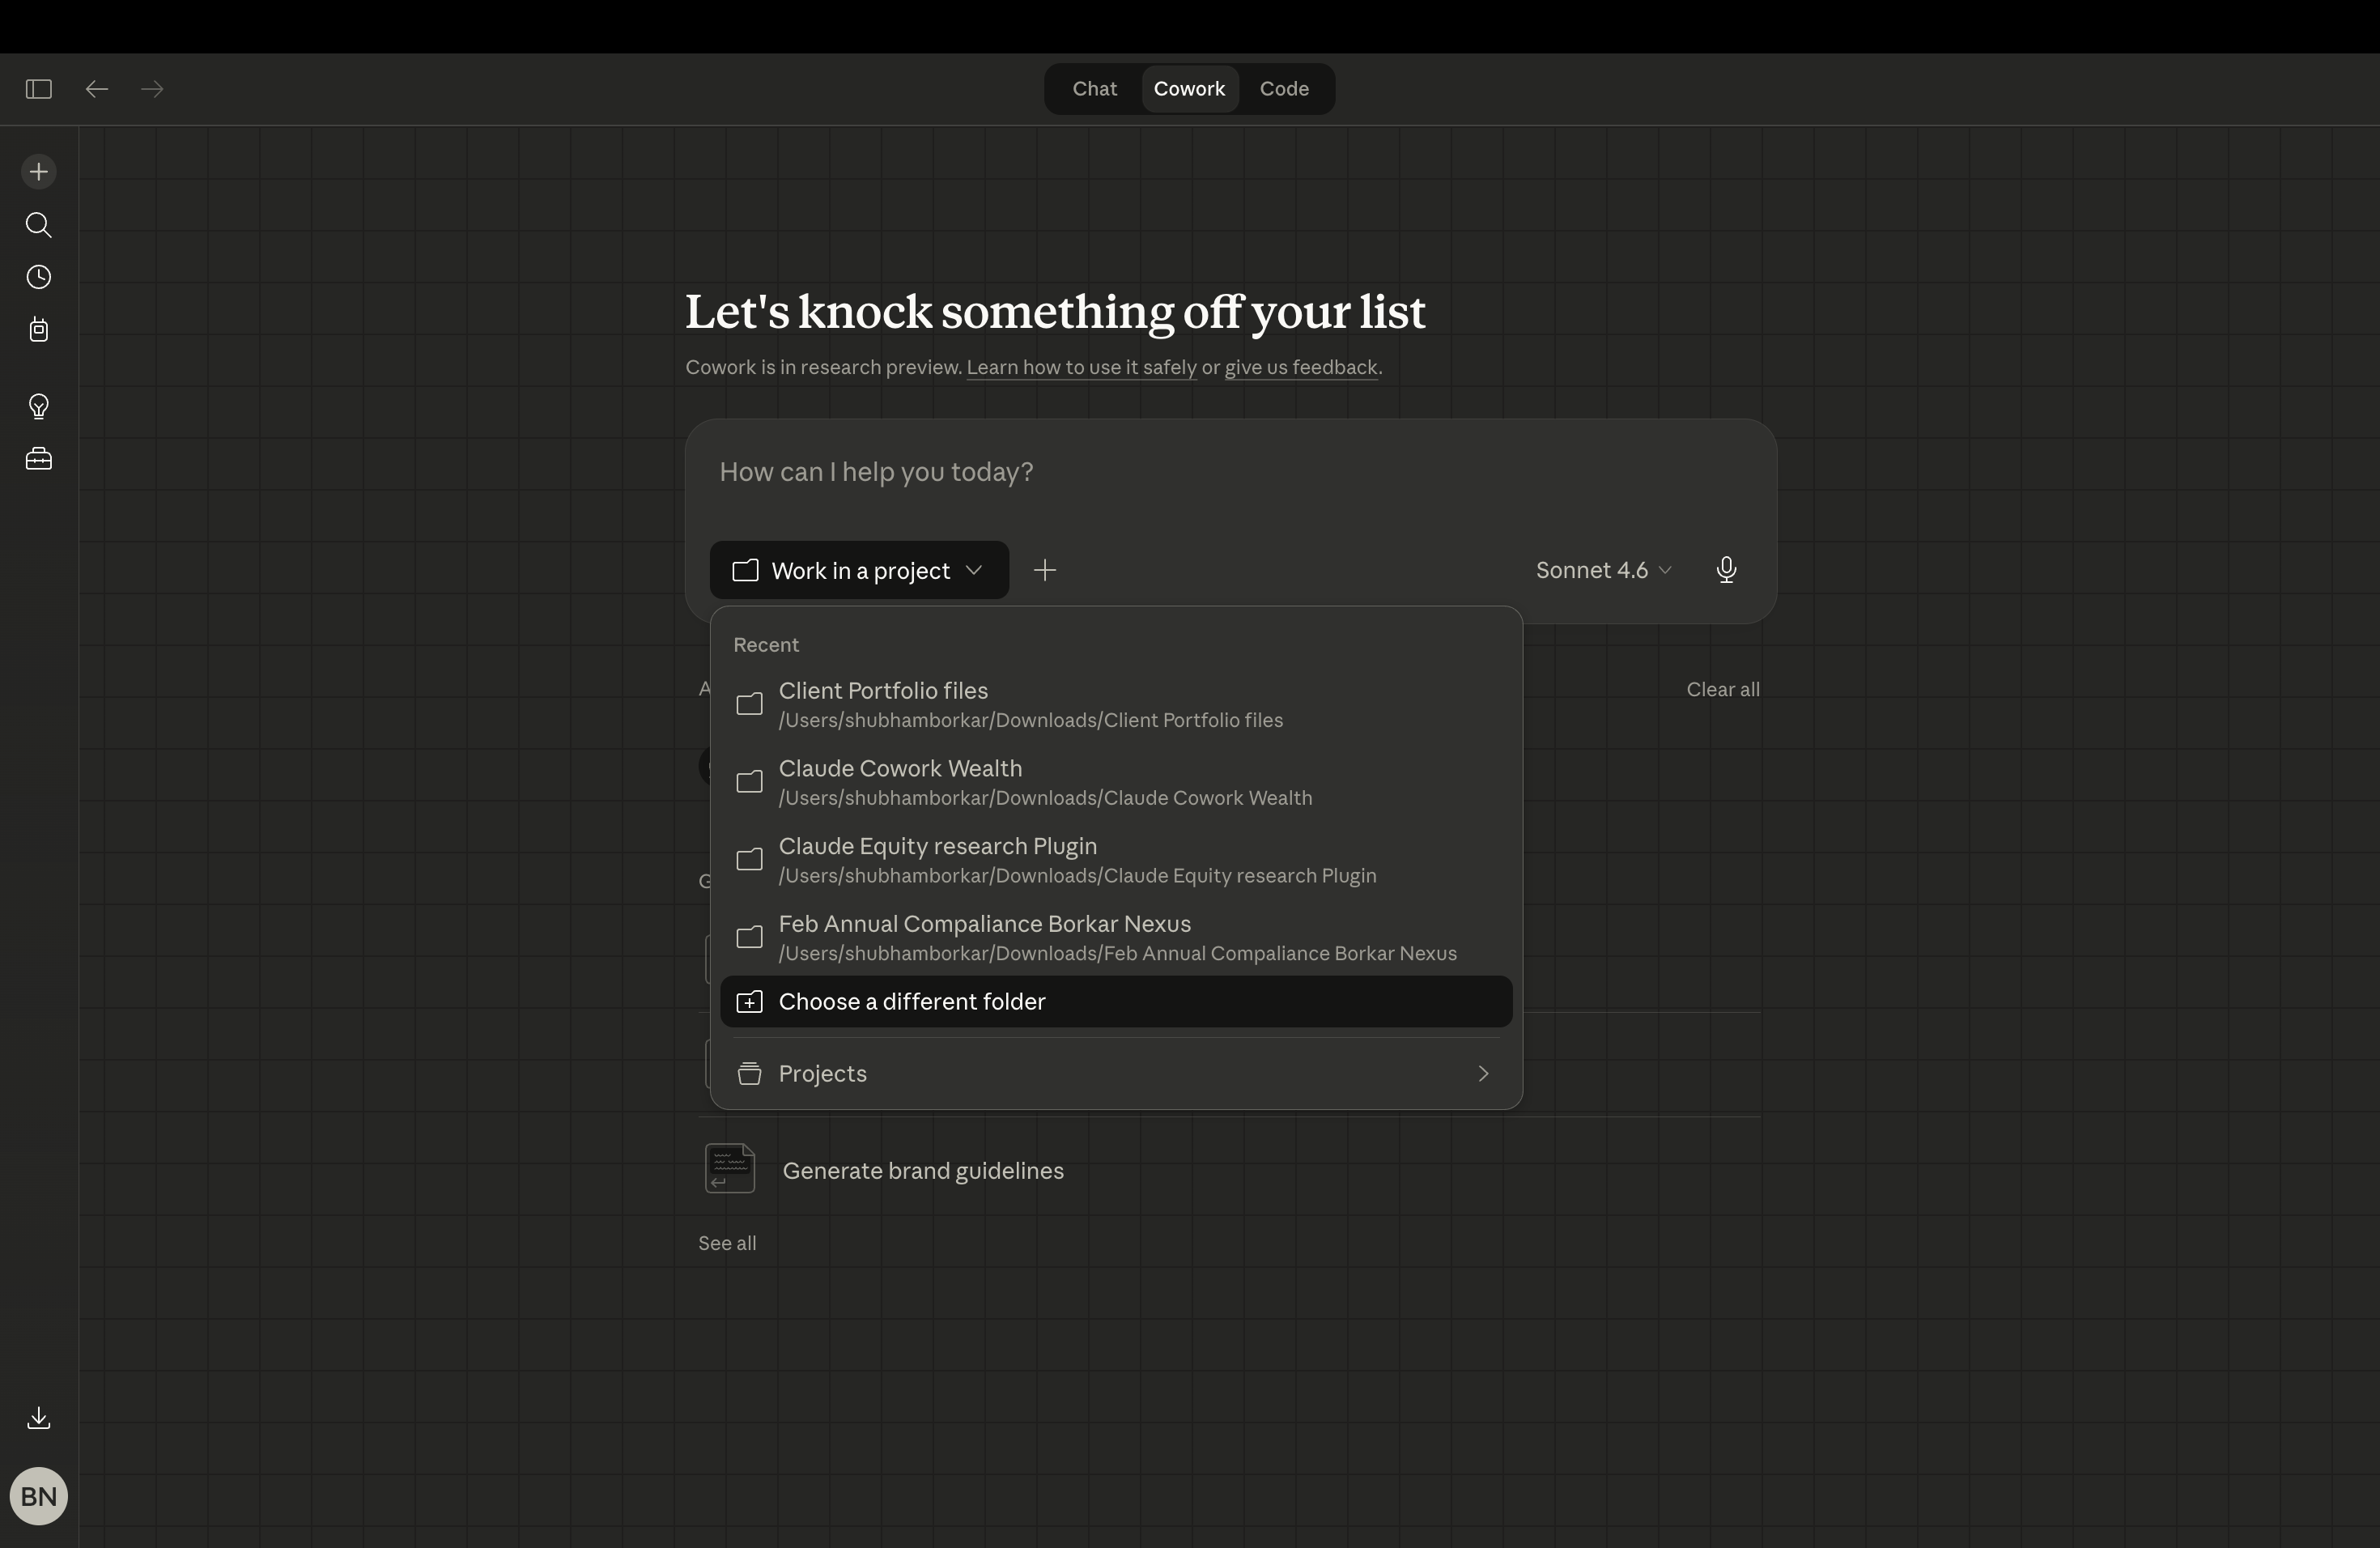
Step 2: Select your working folder.
Open a folder on your desktop. This is where everything lives. Your source files, your firm’s report template, any compliance language you want included. Click the folder icon in Claude Cowork and point it to that folder. Whatever you put in there, Claude can read and use. That is the whole setup.
Step 3: Type your instruction in plain English.
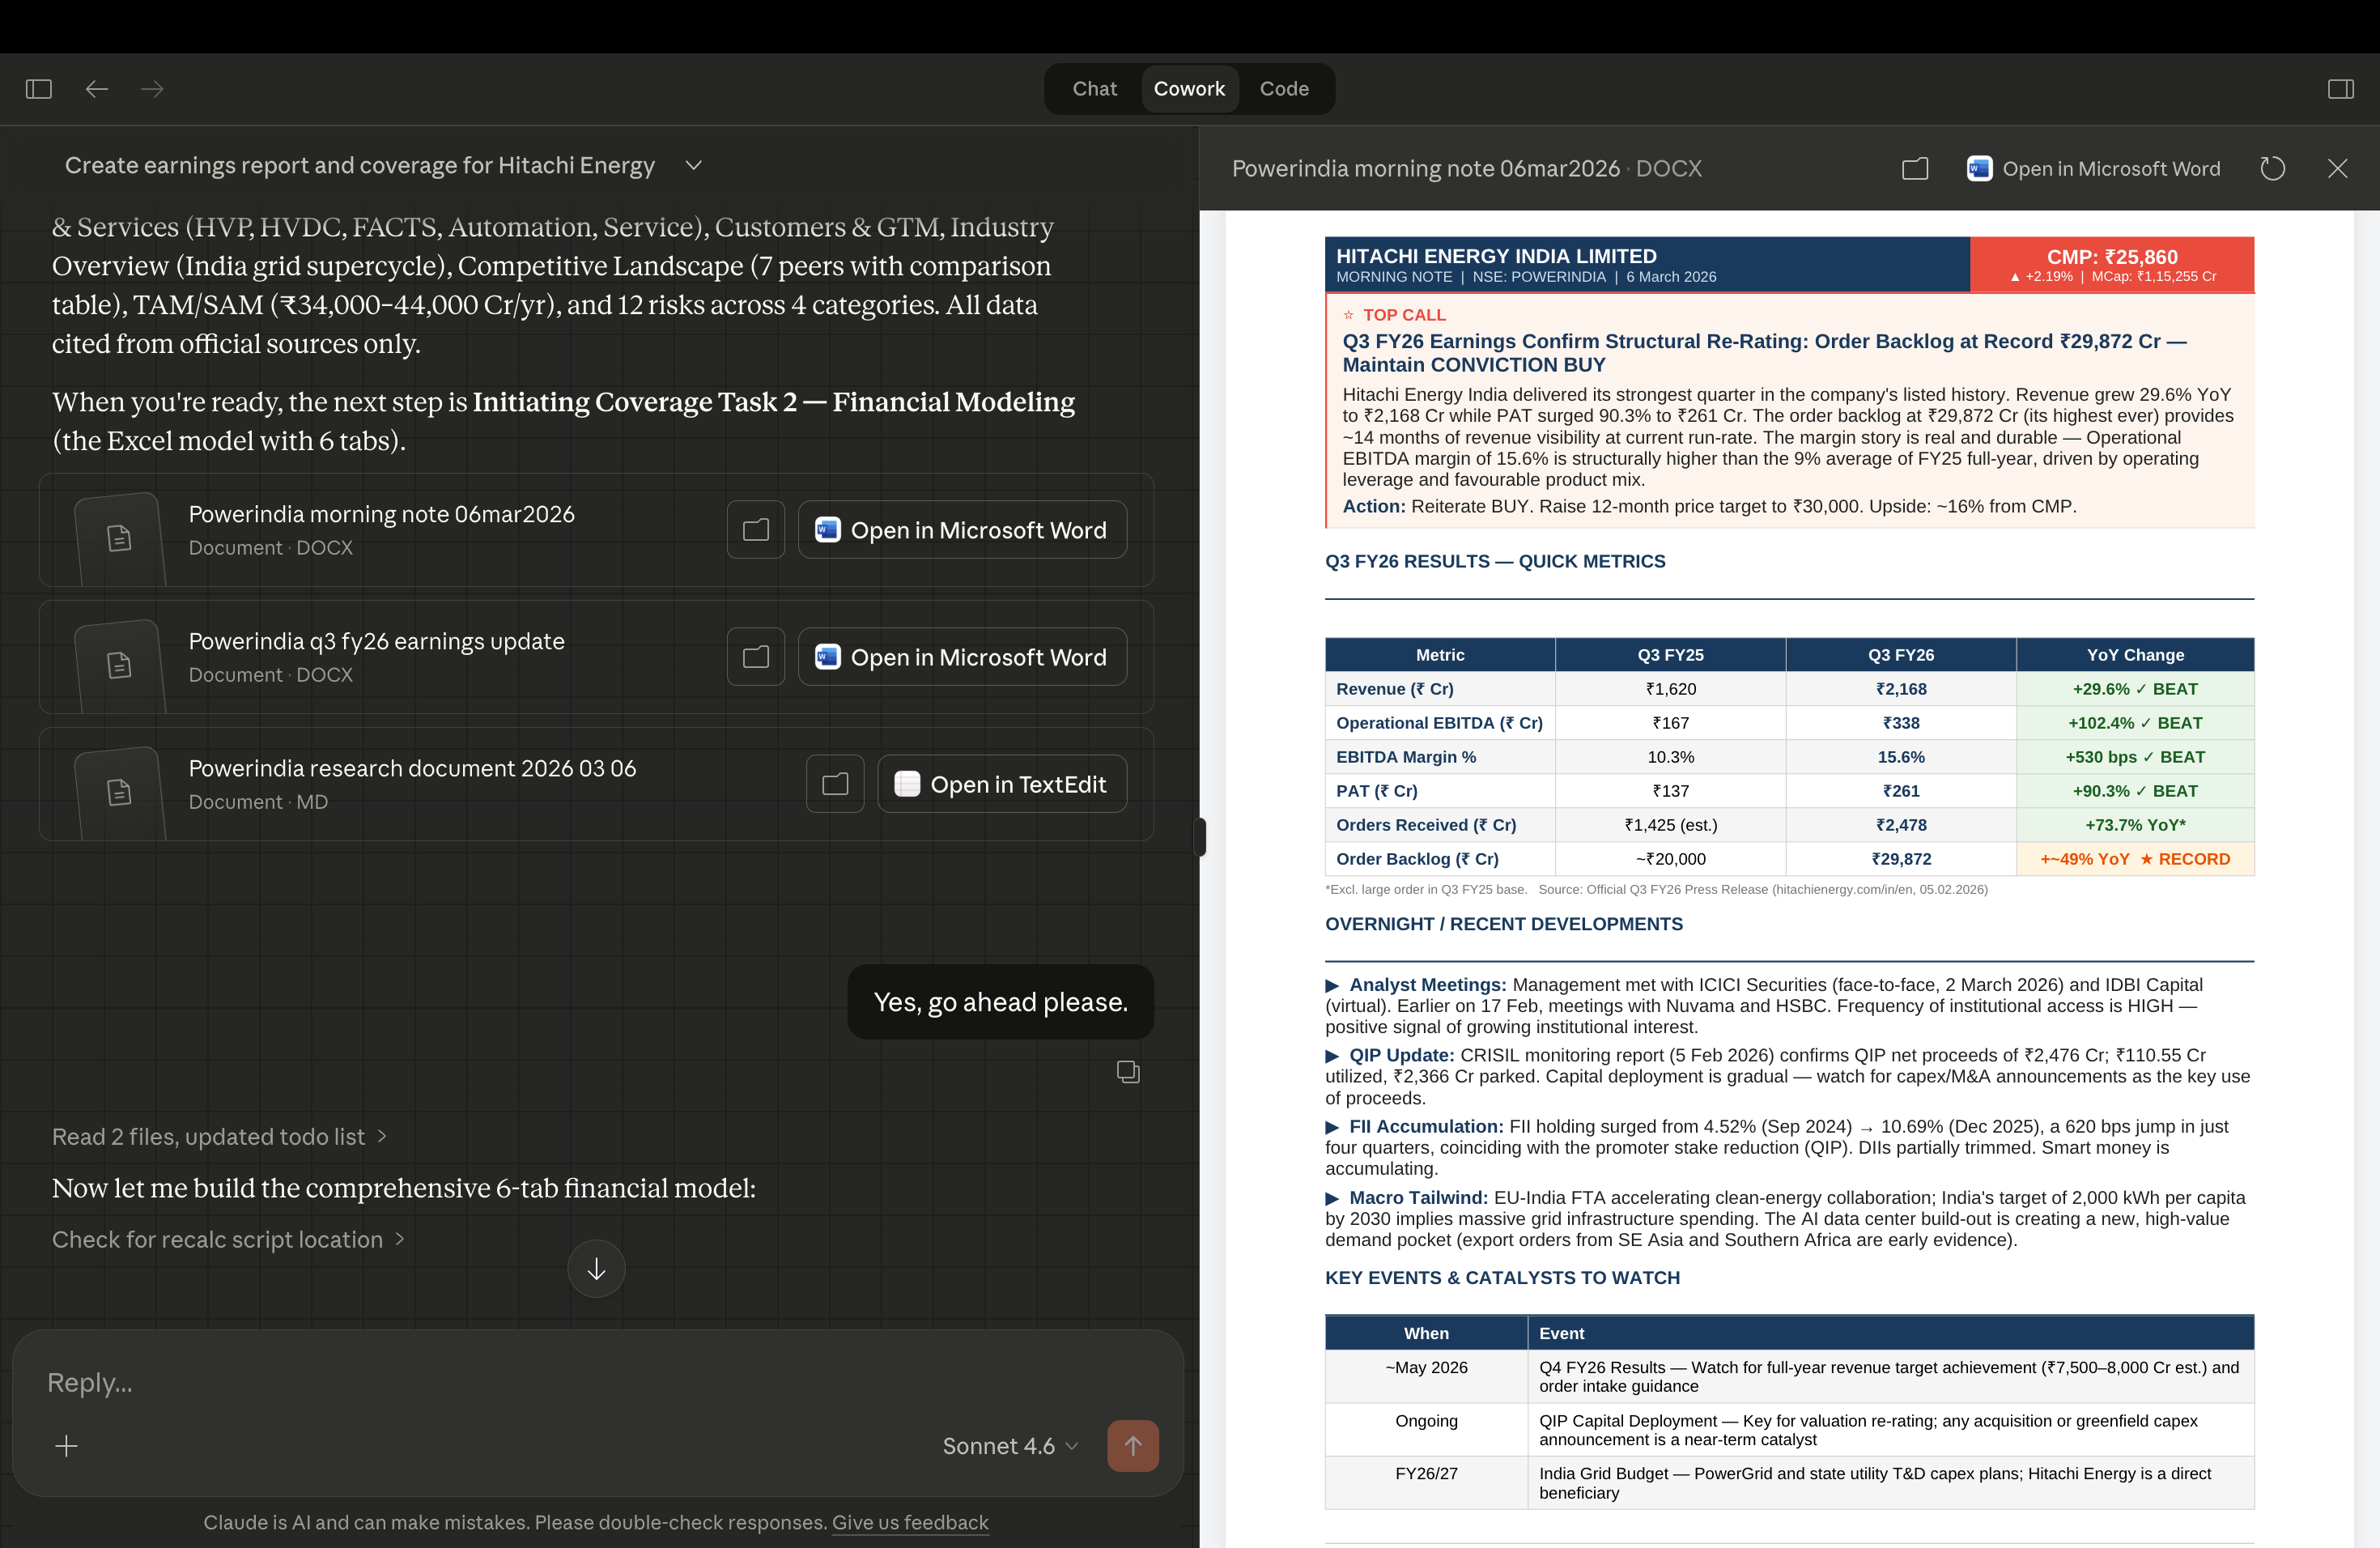
No prompt engineering. No special syntax. Just tell Claude what you want the same way you would brief a colleague. For this report, the instruction was simple: initiate coverage on Hitachi Energy India, build the financial model, run the valuation, write the investment thesis. That was it. One paragraph. Claude Cowork handled the rest.
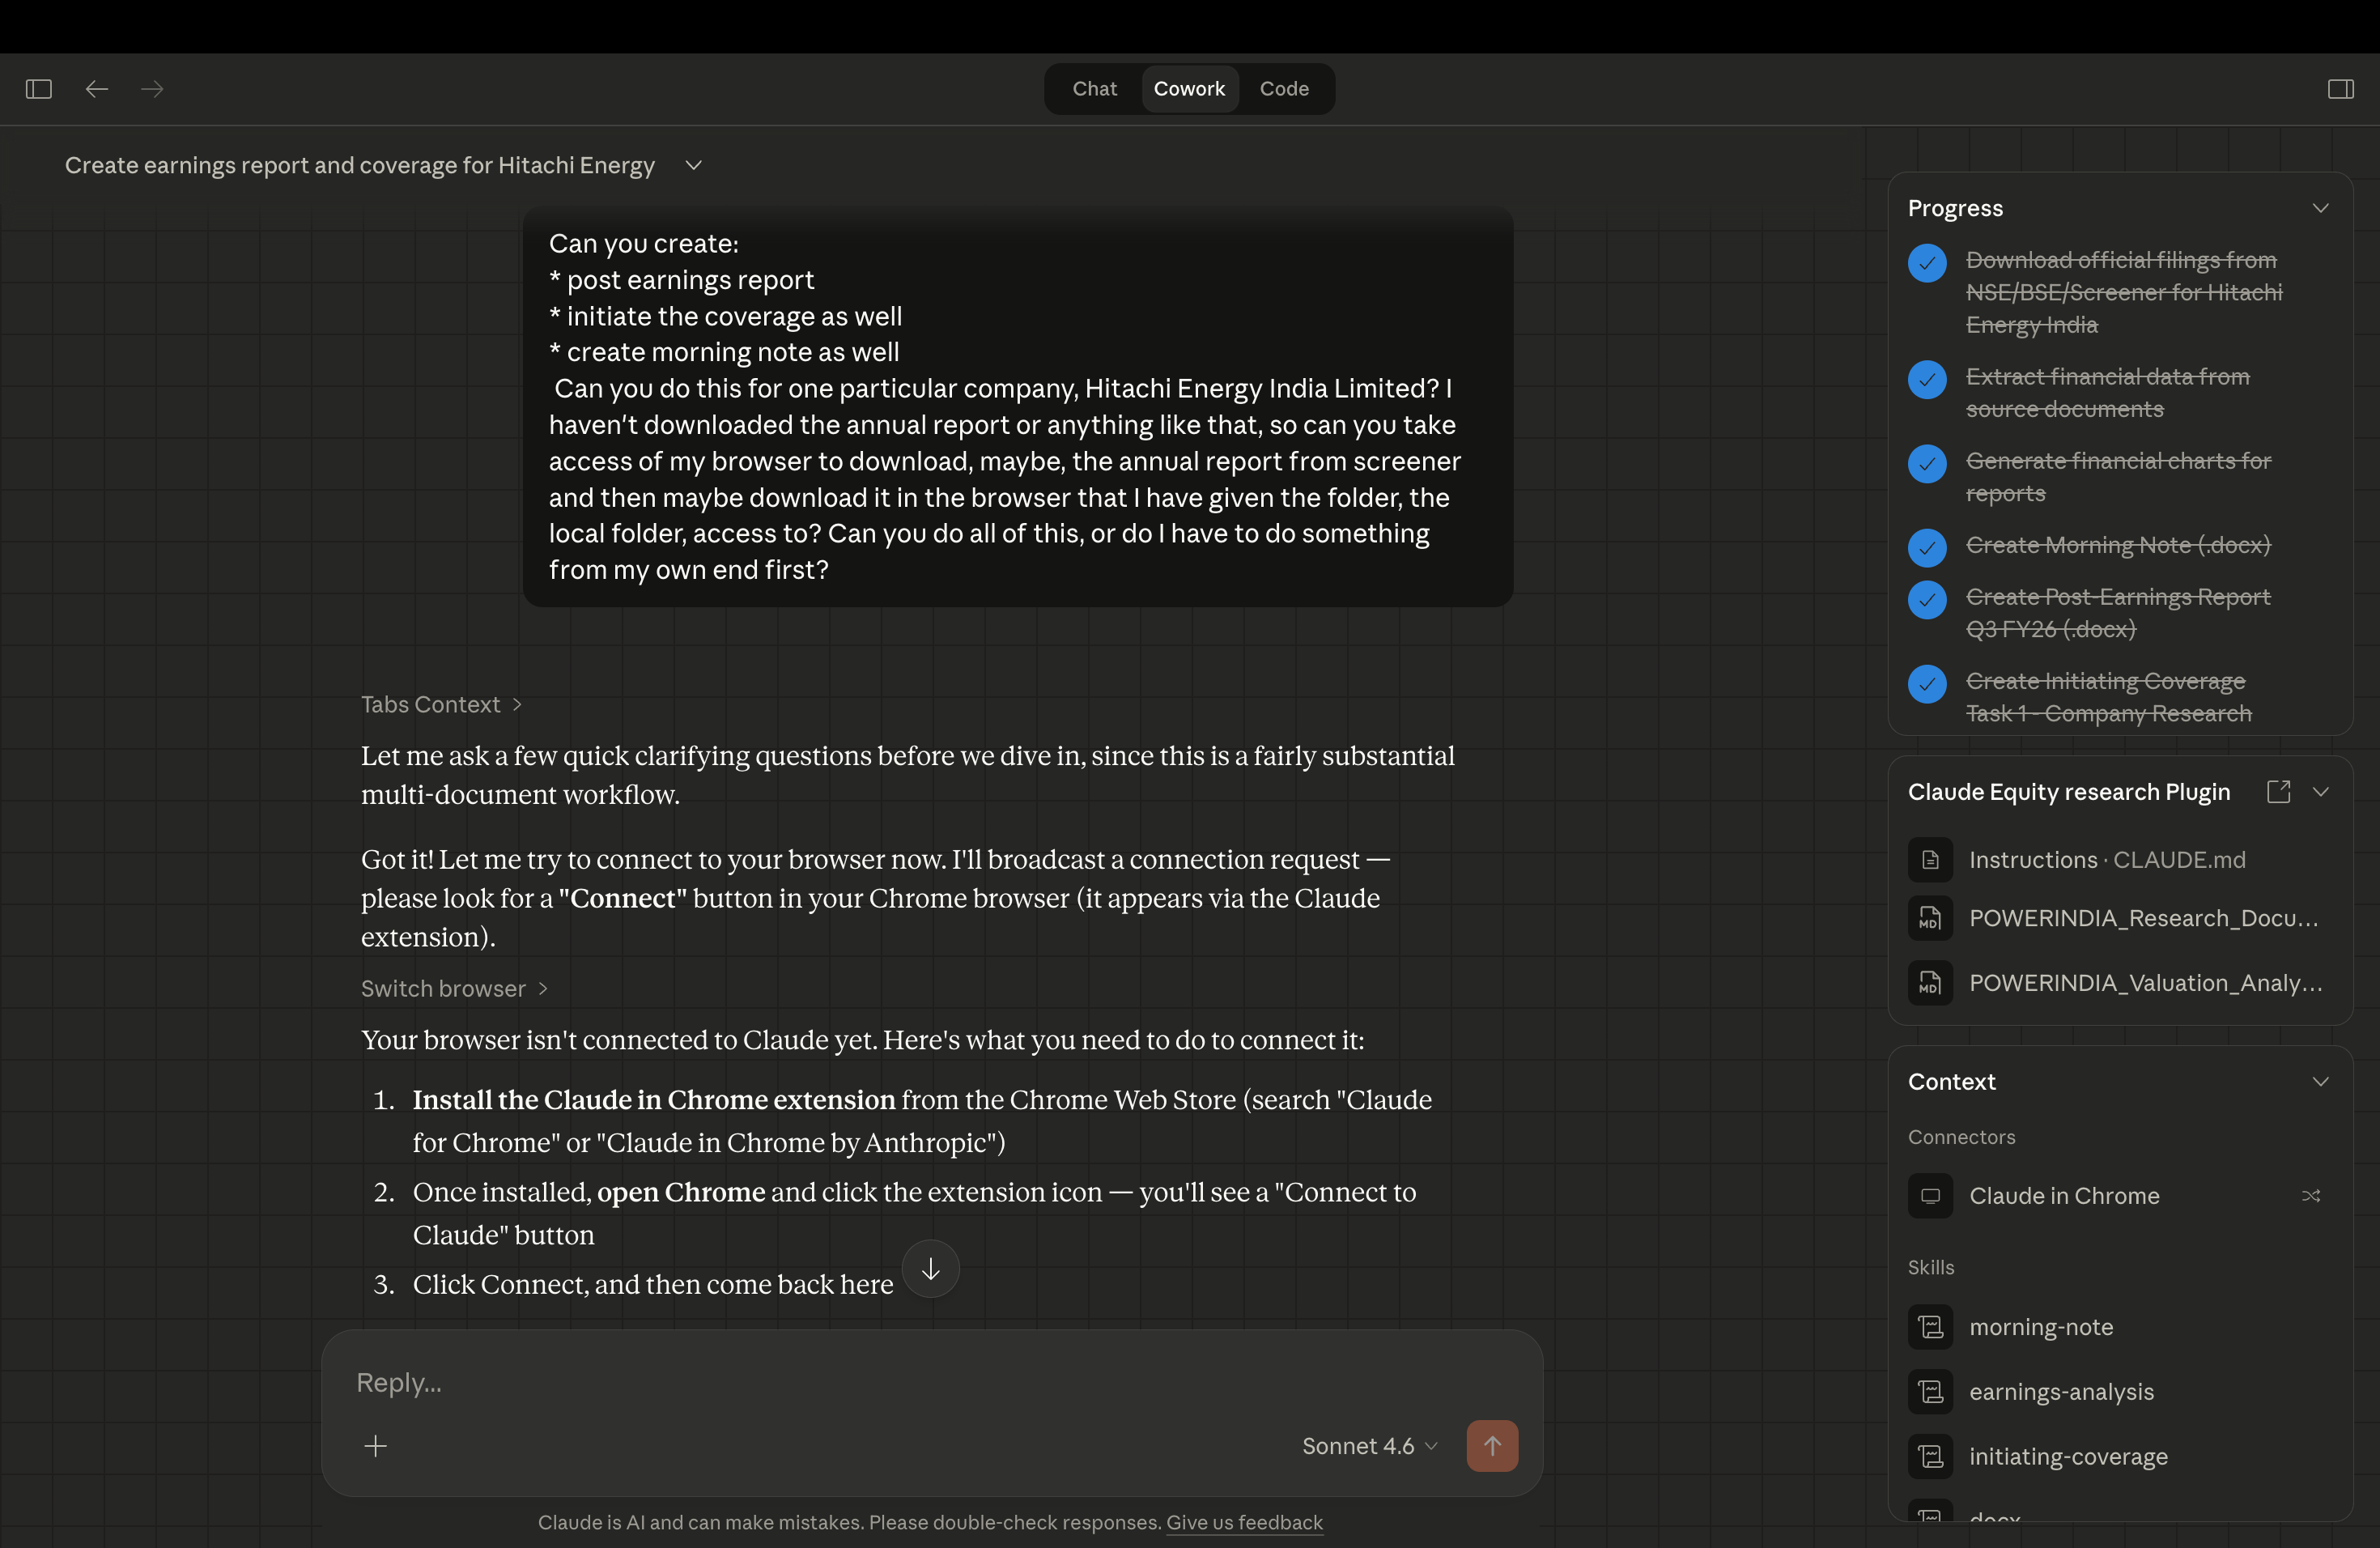
Note: Claude asked for access to my Chrome browser mid-run. It gave me two steps, download the Claude for Chrome extension and sign in. Once I did, it connected automatically and continued. No manual setup beyond that.
Step 4: Let it run. Do not interrupt.
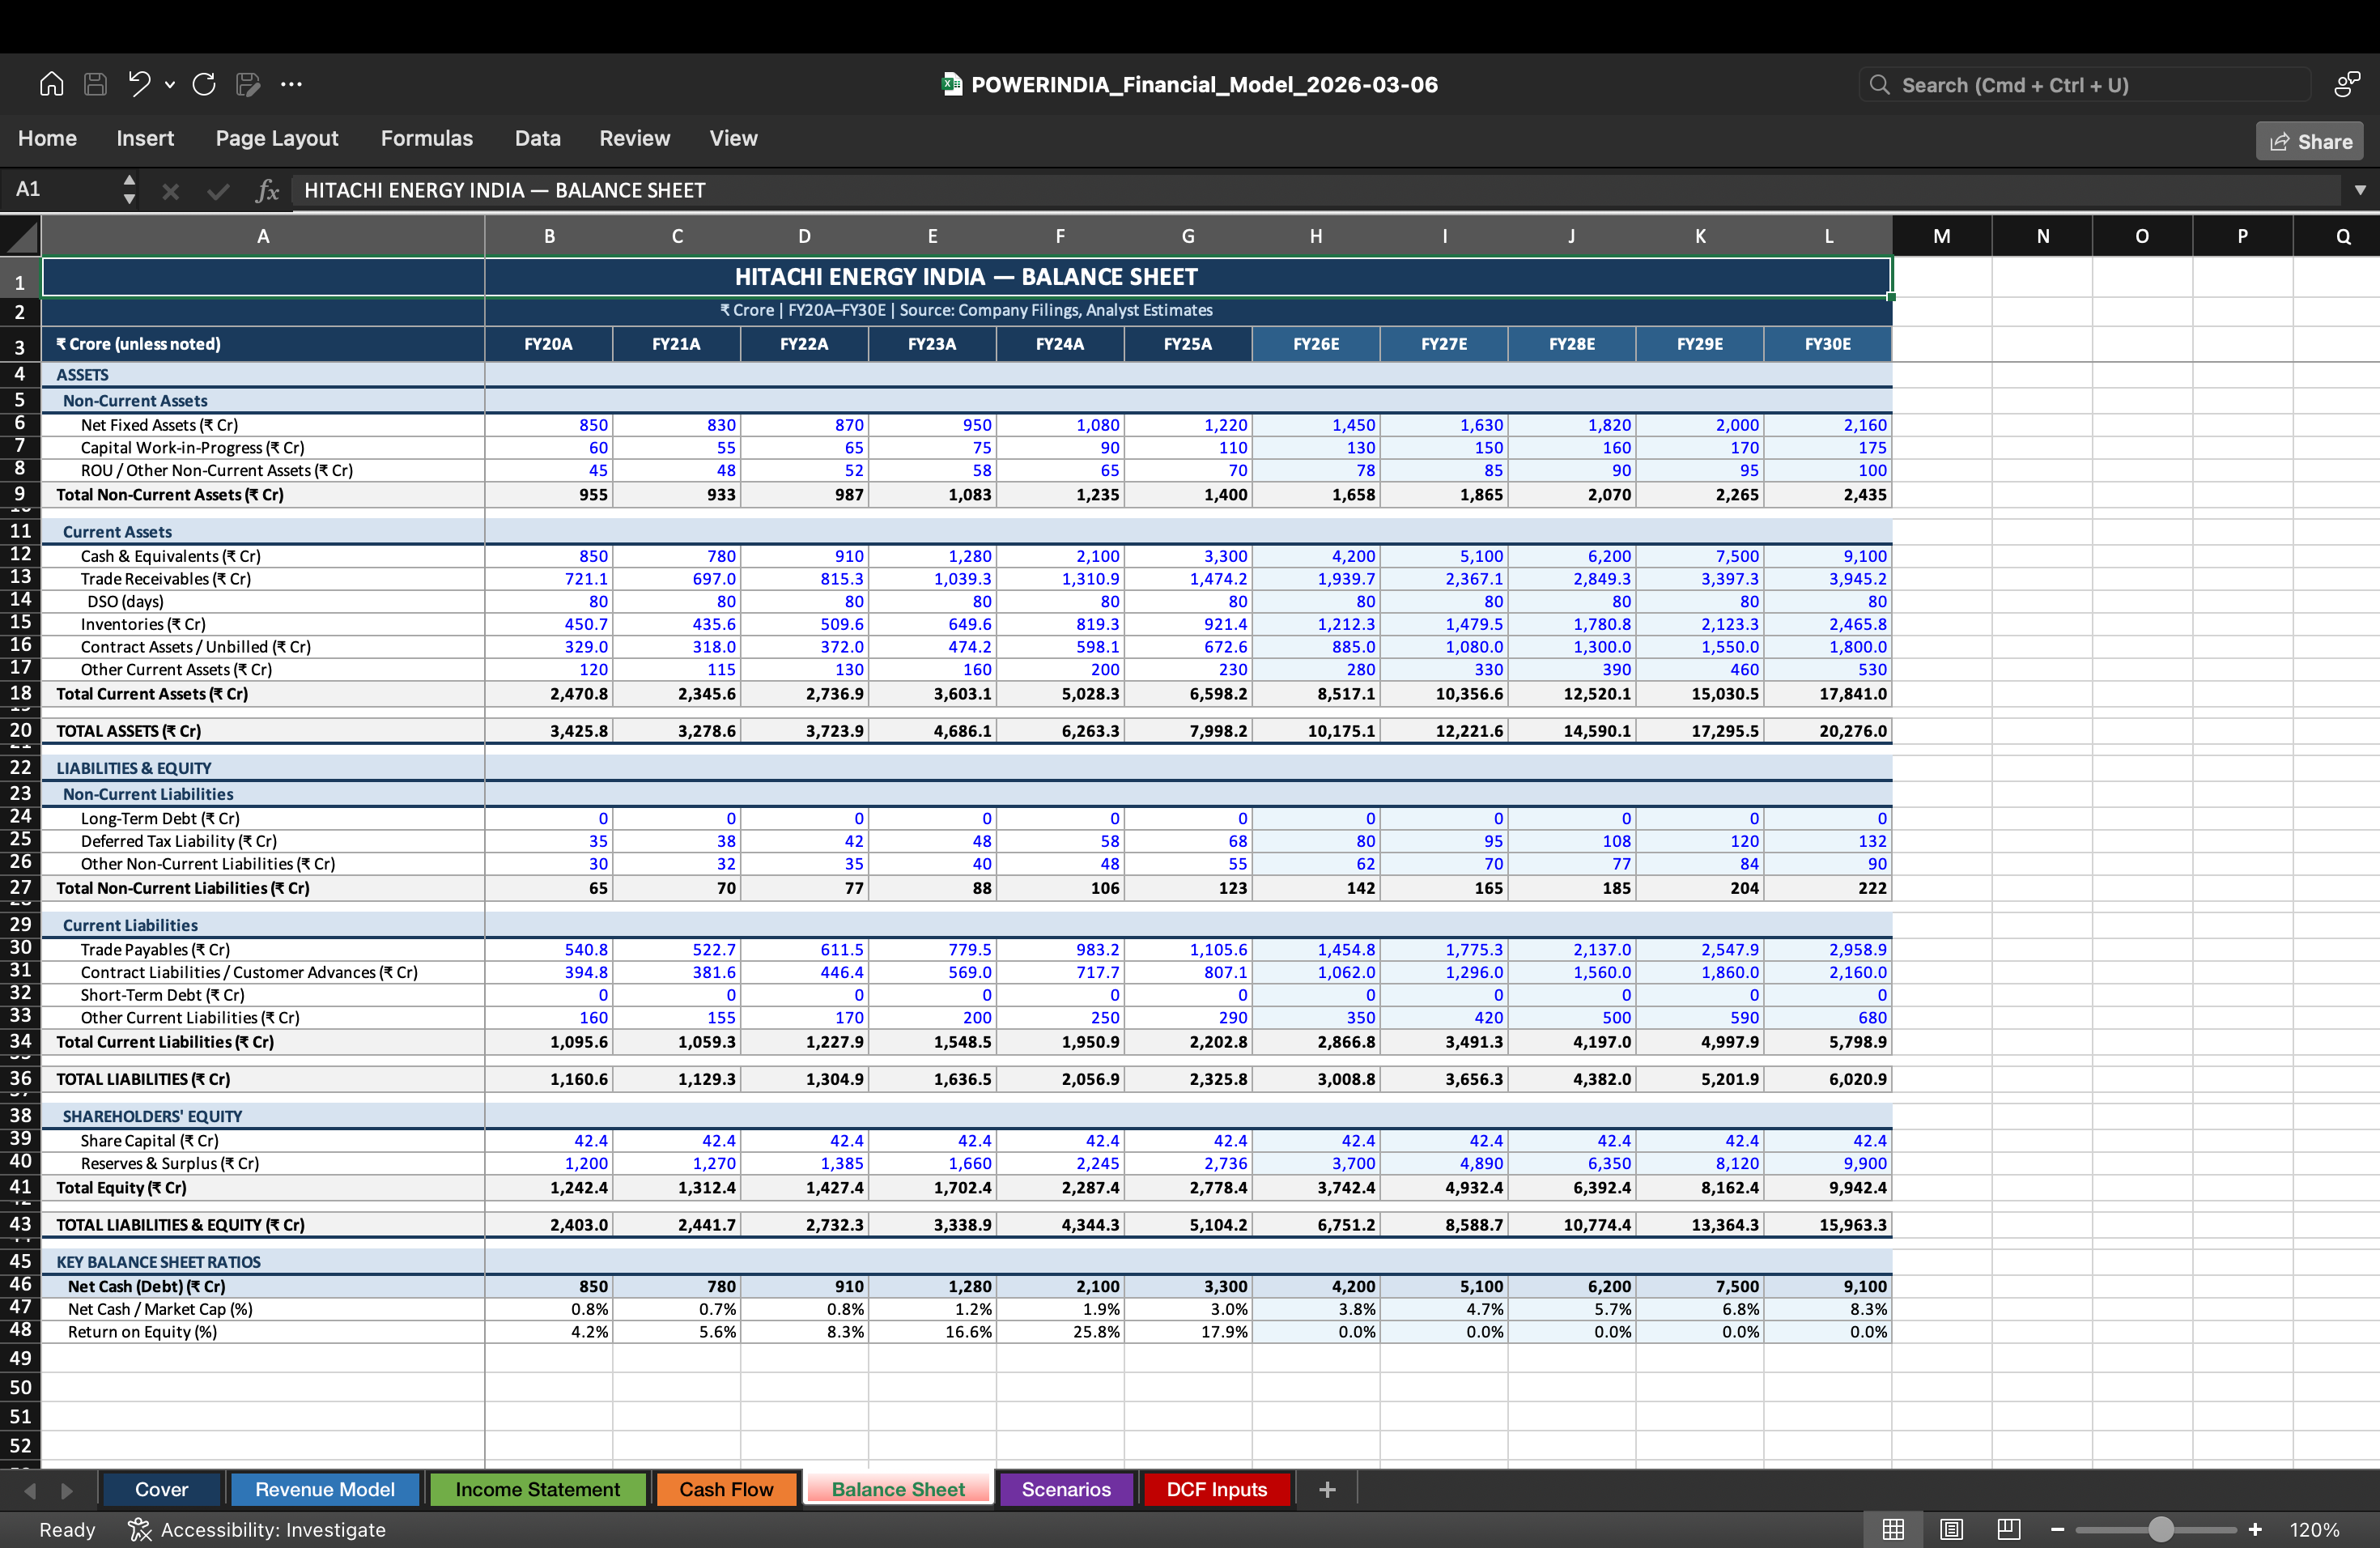
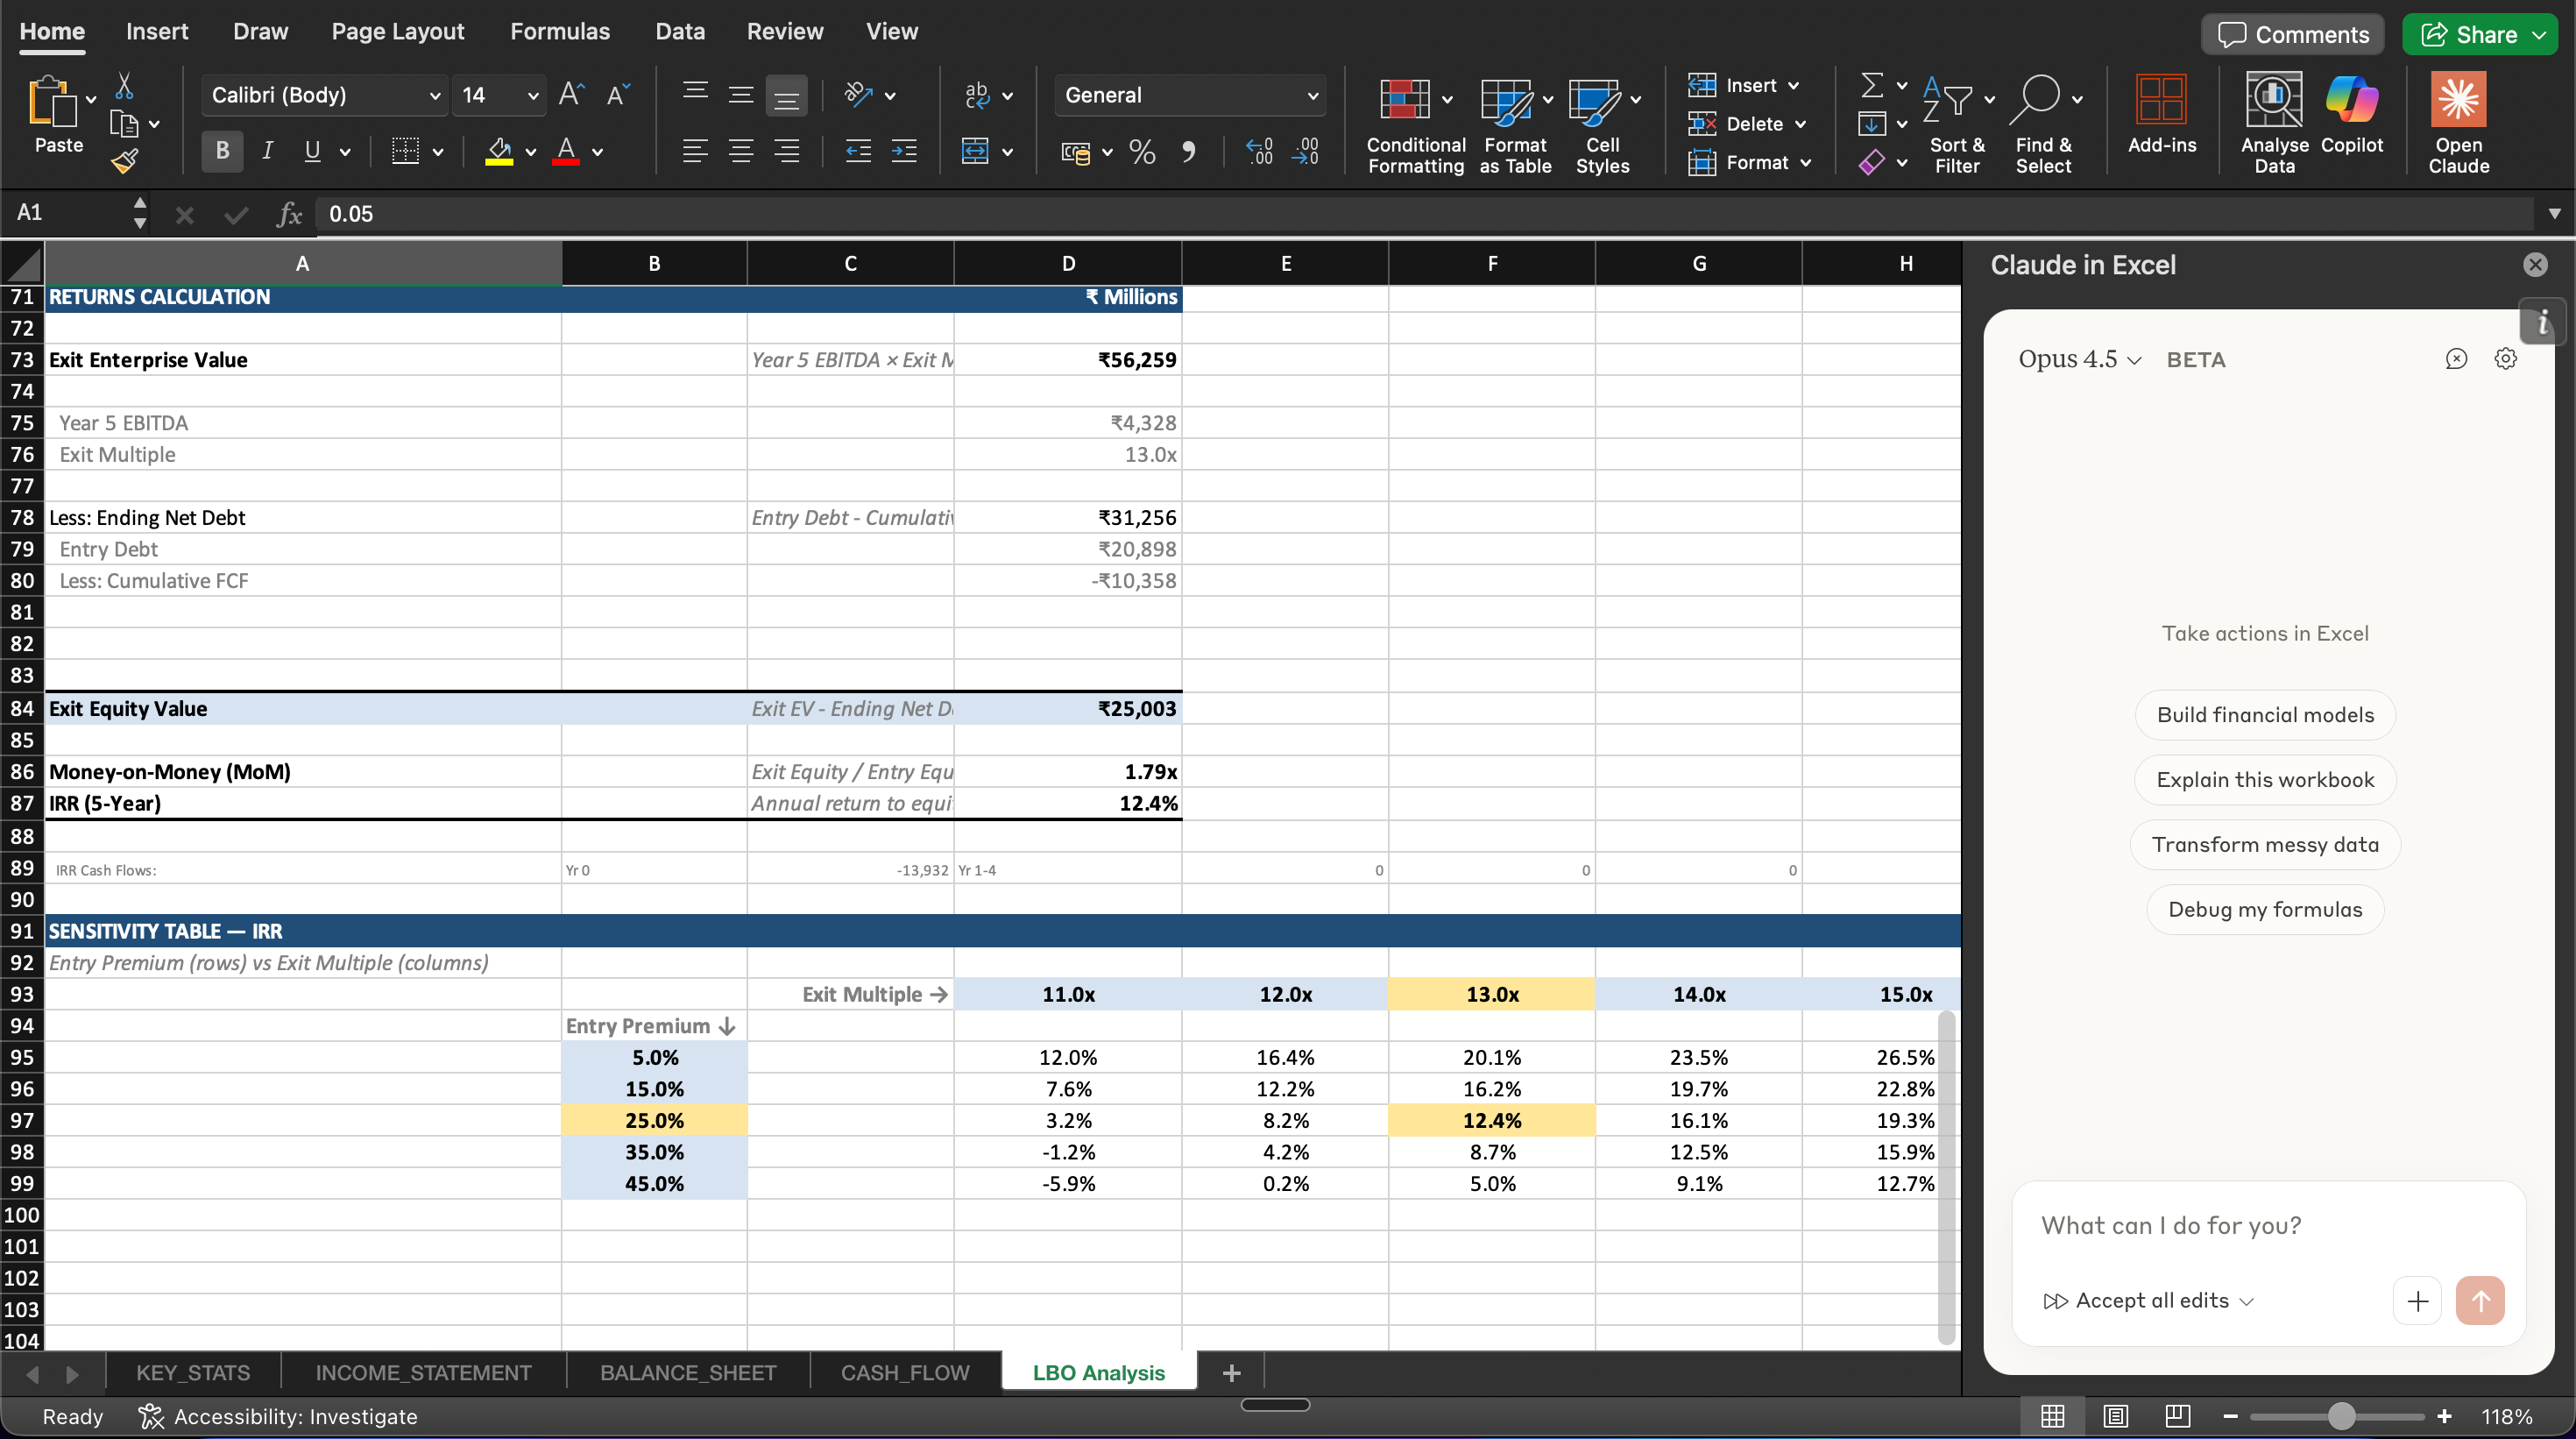
This is the part that feels different the first time. Claude starts pulling data from primary sources: company investor relations pages, BSE and NSE filing portals, Screener.in. It builds the financial model. It writes the investment thesis. It structures the report. You are not doing any of this. You are watching it happen. The instinct is to jump in and correct things mid-run. Resist that. Let it finish. You will have the full output in front of you to audit, challenge, and refine. But first, let it complete the job you gave it.
Step 5: Drop in your template and watch it reformat.
Once the report is generated, take your firm’s template, your Word document, your branded layout, your fonts and colours and drop it into the working folder. Tell Claude Cowork to reformat the output using that template. It reads the structure, matches the layout, and produces the report in your format. Not approximately. Exactly. The output looks like something your firm produced, because in every way that matters, it did.
In this walkthrough, I instructed to add the firm template after the report was already generated. I did that deliberately, to show you the difference between the raw output and the branded output side by side. But this is not how you do it once you start running this regularly.
Before you type your first instruction, put everything into the working folder. Your report template. Your logo. Your brand guidelines. Your colour palette. Your fonts. Your Excel financial model format, if you have one. All of it goes in once, at the start. Claude reads what is in that folder and works within those parameters from the beginning. Every report it generates from that point will come out in your format automatically. You do not reformat after the fact. You do not add a step at the end. The branded output is just the output.
This is a one-time setup. Once it is done, it is done.
Step 6: Audit the output. This is where your expertise matters most.
The report is in front of you. Now read it like a critic, not a cheerleader. Check the assumptions in the financial model against your own view of the business. Push back on the investment thesis. Ask whether the risks section captures what you actually know about the sector. If something is wrong, correct it. If something is missing, add it. The debugging and audit will take another hour, sometimes two. But here is the point: generation plus audit is still a fraction of what the traditional process takes. You are not saving 90 minutes. You are saving two to three days. And you are spending that recovered time doing the one thing that actually requires you, which is thinking.
When it comes to debugging the model, you have three options. The one I prefer is Claude in Excel, you open the Claude plugin directly inside your spreadsheet, describe what is wrong, and it fixes it in the workbook itself. You can ask it to debug formulas, explain what a sheet is doing, or rebuild a section entirely. You can also ask Claude to debug it in the Claude Cowork chat if you prefer staying in one place. Or you can do it manually, the way you always have. All three work.
This is not about replacing the analyst. It is about what the analyst does next.
The research does not get worse when the execution gets faster. It gets better. You have more time to challenge the thesis. More time to stress test the model. More time to cover companies you never had bandwidth for. The workflow handles the mechanical work. You handle everything that matters. That is the shift. And once you have seen it, you cannot unsee it.
The full guide is free. And there is more where this came from.
I put together a detailed resource guide that walks through this entire workflow, every step, every screenshot, and the prompts used. It is on the website, free to download.
If you want to go deeper, there is a premium membership on shikshannivesh.com. You get access to premium workflows, masterclasses, and free consultancy sessions. Everything we build, you get first.
[Download it here: https://shikshannivesh.com/research-in-action/ai-equity-research-with-claude-cowork]
P.S. This was the equity research workflow. Next issue, I am running Claude Cowork on a live portfolio using the Wealth Management Plugin. Same idea. Different domain. If you want to see what that looks like, make sure you are subscribed.
🤝 Help Us Grow This Circle
Thank you for reading and supporting Alpha with AI. If you share this edition with even one person who might find it valuable, it means the world to us and helps this project reach those who need it most.
At Shikshan Nivesh, our goal is simple, to make financial research faster, smarter, and more accessible.
We believe investing should start with understanding and every newsletter we write is built to reflect that.
Written by Shubham Borkar | Research & Insights by Shikshan Nivesh AI Team
Financial Clarity. Insightful Ideas.
Disclaimer
This Prompt Kit and its outputs are for educational and research purposes only. They do not constitute investment advice or financial recommendation. Always verify disclosures and consult qualified professionals before making investment or business decisions.
90 minutes for the draft is the easy part to celebrate. The harder question is what happens after.
The analyst who spent three days on the report also spent three days developing conviction in the thesis. The one who got it in 90 minutes still needs to stress-test whether they actually believe it or just agreed with a well-written output. The time saving is real. The risk is that speed becomes a substitute for judgement instead of a complement to it.