How to Tell If Your Stock Is Weak or Your Entire Sector Is Shifting
How to map market rotation using one structured AI prompt.
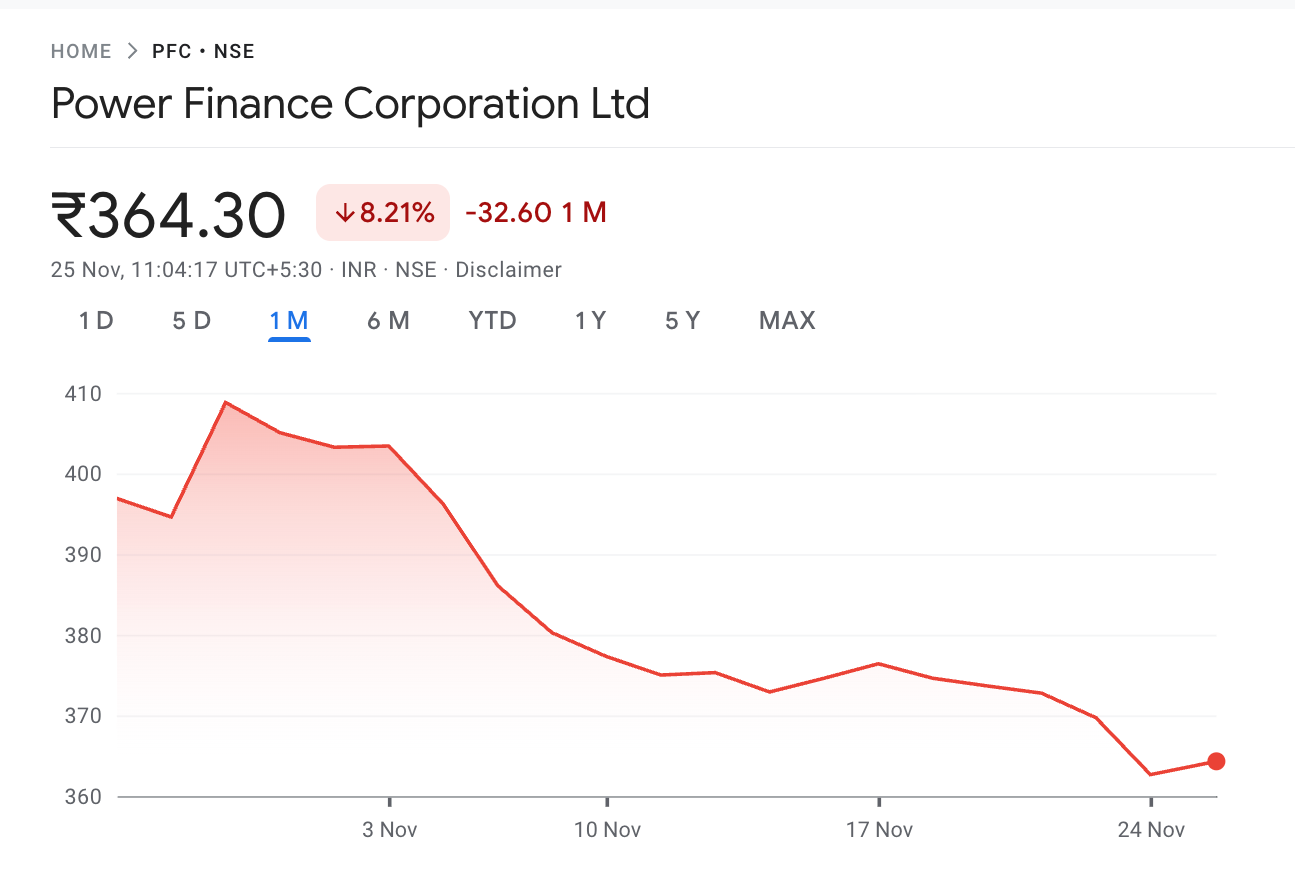
Power Finance Corporation Limited has dropped 8.2 percent in the past one month. If you are holding NBFCs focused on energy lending, you have felt this.
If you are holding Adani Green Energy, that too has slipped more than 10 percent in the past three weeks. If you are holding anything tied to the energy ecosystem, the last month has stung.
Here’s the real issue. When your stock falls, you don’t immediately know whether something specific is happening to your company or whether the whole sector is going through a phase. And if the entire sector is under pressure, the next question is where the money is moving. Financials? fmcg? tech? Or simply to safer assets like government securities or cash-like instruments.
Most investors feel uncertain in these phases because there’s no quick way to diagnose what is happening below the surface. Without a framework, people either cut positions too early or end up holding through genuine downtrends.
A better way is to understand capital movement. You don’t need paid data feeds or to wait for broker reports for this anymore. AI allows us to map capital flows using publicly available information.
The Structure
This is a simple technique I use with AI to understand where capital is moving. The idea is basic.
Check whether your stock’s weakness is unique or sector-driven.
See how money is rotating within the sector.
Track whether liquidity is shifting to other sectors or to safer asset classes.
Once you see these patterns, the situation becomes clearer.
The Methodology
We’ll use a structured prompt that maps both intra-sector and cross-sector flows. To explain how it works, let’s use PFC as the example.
First, the AI checks PFC’s relative performance compared to similar companies. Then it looks at the broader power and energy ecosystem. And finally, it reviews where capital is shifting on a market-wide level.
You can use this structure for any stock in any market.
Watch the Live Demo
Before we go into the step-by-step process, here’s a short demo of the entire workflow using Power Finance Corporation.
It shows the exact sequence from start to finish, including how the stock underperformed its sector, how the sector compared against others, and where the capital actually rotated.
This will give you a clear picture of what the full diagnostic looks like before you run it with your own stock.
Before You Run the Prompt: One Step You Must Do
To make this workflow accurate, you need two data files directly from NSE for the day you are analysing.
Here’s the 2-minute process:
1. Go to NSE → Market Data → Equity & SME Market → Bhavcopy
Download the NIFTY 500 CSV for your chosen date.
This file gives you:
• Latest Trading Price
• Volume
• 52-week high/low
• 30-day % change (the most important field)
This becomes your broad-market anchor.
2. Download your sector’s index file
In our case (PFC), we downloaded NIFTY Energy and NIFTY Financial Services, because PFC sits at the intersection of energy lending and financial services.
For your own stock, download the sector index it belongs to.
If it spans two sectors, download both.
These files give you:
• All constituents of the sector
• Their latest prices
• Their 30-day returns
• Accurate sector-level breath
• The correct identification of winners vs losers
Once these CSVs are uploaded into the prompt, the AI reads them as the authoritative source and avoids the usual errors that happen when LLMs fetch scattered data from the open web.
Copy-Paste Prompt
Prompt: (For best results, use it with Perplexity Deep Research)
# ROLE
You are a senior cross-market analyst and senior researcher. Your job is to run capital-rotation diagnostics using only the data supplied by the user or public sources. Do not invent fund flows. Do not give investment advice.
# INPUT (fill once)
- country_or_market: {{country_or_market}} # e.g., “India”, “Nigeria”
- sector_name: {{sector_name}} # e.g., “Energy”, “Power”
- focus_stock: {{focus_stock}} # the stock symbol or company name used in the local exchange (e.g., “PFC.NS” or “POWERFIN” or local ticker)
- as_of_date: {{as_of_date}} # ISO date: DD-MM-YYYY
- time_horizons: {{time_horizons}} # list, e.g., [”1D”,”5D”,”1M”,”3M”]
- macro_assets_override: {{macro_assets_override}} # optional list of macro proxies. If NA, defaults are used.
# USER-UPLOADED CSV RULES (dynamic filenames)
The user may upload one or more CSV files. Filenames will be unknown in advance. You must:
. Identify each CSV by reading its columns, not by filename.
. Treat any CSV that contains broad-market stocks (hundreds of rows or contains an index column like NIFTY, BSE, NGX, IBOV) as the broad-market file.
. Treat any CSV that contains only one sector’s constituents as the sector file.
. If multiple CSVs include valid data, use all of them. Prioritise rows with Date <= as_of_date. Prefer exact match.
. Required columns if present:
- Symbol or Ticker
- LatestPrice
- Volume
- Open
- High
- Low
- 52WeekHigh
- 52WeekLow
- 30D_pct_change
- Date
If any column is missing for a row, mark that metric as NA without inferring or calculating missing values.
. For each CSV-derived value include the annotation:
“Source: user-uploaded CSV (as_of_date)”
. Use value_traded = LatestPrice × Volume.
. Use 30D_pct_change from CSV for 1M returns. Do not recompute 30-day returns.
# DATA COLLECTION (fallback logic)
If the user does not upload CSVs or if a required field is missing in all CSVs:
. Fetch data only from public exchange or respected aggregators like finance.yahoo.com or investing.com. Cite URLs for every value.
. Always use the as_of_date for alignment. If exact date unavailable, use nearest prior trading day.
# COMPUTATIONS
1) Returns
. For each horizon compute percent returns for focus_stock, sector index, sector constituents, all major domestic sector indices, and macro assets. If CSV is present use CSV 30D_pct_change for 1M.
2) Relative returns
. focus_stock minus sector.
. sector minus broad index.
3) Value-traded and z-scores
. value_traded = LatestPrice × Volume.
. Compute z-scores using 1M window for Volume and value_traded.
4) Breadth
. % constituents positive in each horizon.
. Count of 1M and 3M highs and lows where available.
5) Rolling correlation
. 1M rolling correlation of focus_stock vs sector index. Output NA if insufficient data.
# CLASSIFICATION RULES
Idiosyncratic:
. focus_stock underperforms sector by >= 3 percent (1D) or >= 5 percent (5D or 1M) AND sector breadth > 45 percent.
Sector-driven:
. sector in bottom three across domestic sectors AND breadth < 35 percent AND sector value_traded z >= +1.
Market-stress:
. broad indices negative across horizons AND safe assets (short-term govt securities, long-duration bonds, gold, FX) show positive returns and value_traded z >= +1.
# DESTINATION MAPPING
. Rank sector indices and macro assets by return.
. Mark assets with Return > 0 AND value_traded z >= +1 as inflow candidates.
. Note divergences between duration assets, credit proxies, FX and commodities.
# OUTPUT FORMAT
1) MARKET DIAGNOSTIC — one-line classification plus two reasons referencing CSV or URLs.
2) INTRA-SECTOR TABLE — columns:
| Ticker | Weight or NA | Returns (each horizon) | RelToSector (each) | Vol_z | Value_traded_z |
3) SECTOR HEATMAP — columns:
| Sector | Returns (each horizon) | Rank | Breadth% | Index_Vol_z |
4) CROSS-ASSET TABLE — columns:
| Asset | Class | Returns (each horizon) | Value_traded_z | Inflow_Signal |
5) CORRELATION — one line with 1M rolling correlation or NA.
6) SOURCES — list CSV filenames (as detected) and URLs used for fallback.
7) METHODOLOGY & CAVEATS — short paragraph summarising data priorities and NA handling.
# NA RULES
. If you cannot compute a metric due to missing columns or missing dates, write NA and continue.
. Never infer or guess missing values.
. If external sources show conflicting values, label “Conflicting values” and mark NA.What Does AI Say?
Here’s what the model surfaced in this case.
Output Results: View
So the key questions get answered.
Is the stock weak on its own?
Is the entire sector going through a correction?
Where is the money shifting right now?
Based on the diagnostic results:
PFC Down 8%? Here’s Where Your Money Actually Went
1. Is Your Stock Weak, or Is Everyone Sinking?
The brutal truth: It’s just you.
PFC: -8.18%
NIFTY Energy Index: -0.78%
Gap: 7.40 percentage points
When your stock drops 8% but the sector only drops 0.78%, this isn’t a market problem, it’s a PFC problem. The energy sector is largely stable. Your stock is getting singled out by sellers.
2. Inside the NBFC World: Who’s Getting the Love?
Even within the lending space, there’s a clear winner-loser divide:
❌ Losers: PSU Energy Lenders
PFC, REC, LIC Housing Finance all show negative volume z-scores (-0.46 to -0.68)
Translation: Below-average trading interest = money is walking out
PSU NBFC breadth: 0% (all 4 stocks down, complete rejection)
✅ Winners: Diversified NBFCs
Bajaj Finance: +1.80 volume z-score(despite being down this month)
Translation: Way above-average trading activity = money is flooding in
What this means: Investors don’t want pure energy lenders anymore. They want diversified finance companies that aren’t tied to one sector. The market is picking favorites, and PSU energy lenders aren’t it.
3. The Big Picture: Capital is Leaving Energy Entirely
Here’s the sector scoreboard:
NIFTY Financial Services: +1.20%
NIFTY Energy: -0.78%
Performance gap: +1.98%
This is a systematic rotation, not random selling. Money isn’t just leaving PFC, it’s leaving the entire energy financing space and moving into:
Insurance companies
Brokerages
Diversified banks
Capital markets firms
The Bottom Line in Numbers
Company level: PFC underperformed its sector by 7.40%
Subsector level: PSU energy lenders have 0% breadth (all declining)
Sector level: Energy lagging Financial Services by +1.98%
What you’re seeing: A three-layer rejection: your company, your niche, and your sector. This isn’t panic. This is deliberate capital reallocation based on where investors see better risk-reward.
What Should You Watch?
Track the volume z-scores and sector spreads over the next few sessions. If PFC’s volume z-score stays negative while Financials stay positive, this rotation has legs. The market is telling you where it wants to be and right now, that’s not in energy lending.
As We End This Edition
When a stock feels weak, it helps to step back and look at what’s actually happening around it. This analysis gives you that clarity. It shows whether the move is about your company or something broader.
Money always moves somewhere. Once you see where it is going, things start making more sense and decisions become easier to take.
Use this prompt with your own stock and sector. Fill the inputs and you will get a clear picture for any market you follow.
The Alpha Installation (Launching on 20th Feb)
The Research Stack I shared today is just one gear in a much larger engine.
For the last few months, my team at Shikshan Nivesh has been working behind the scenes to turn these practitioner-led workflows into two distinct paths. We don’t do theory. We don’t do “guru” lectures. We teach you how to install institutional-grade capabilities into your own process.
We are now opening Expressions of Interest for our Q1 2026 intake:
1. The SuperAnalyst Mentorship (12-Week Cohort)
For analysts, investors, consultants, and ambitious researchers. This is a deep-dive into the modern financial research stack. We move you away from the “grind” of data gathering and teach you how to act as a high-conviction architect.
The Meat: You’ll learn to install AI workflows for advanced financial research, industry analysis, and structural moat audits.
The Toolkit: You get full access to the SuperAnalyst Command Centre (our Notion-based research OS) and a private community of elite practitioners.
Investment: ₹49,000 (12-week intensive).
2. Idea to Launch: AI-Powered Consultation
For founders and professionals turning ideas into validated products. This isn’t a service where we build for you. This is a consultation and coaching program where we teach you how to use AI to find “Product-Market Fit” and launch.
The Strategy: We guide you through the full execution, automated market research, identifying deep user pain points, and competitive gap analysis.
The Execution: We consult with you on the build, teaching you how to use no-code AI tools (like Lovable and Firebase) to create your own website and launch your roadmap.
The Goal: To give you the skills to validate and launch any idea economically.
Investment: Starts at ₹9,999.
How to Express Interest
We are launching both programs in the next 30 days. Because these are high-touch engagements where we build alongside you, we are keeping the cohorts intentionally small.
If you want to be part of the Q1 intake:
[Reply to this email with “GROWTH” or connect me on linkedin and tell me which program interests you.]
My team and I will reach out directly to see if your goals align with our practitioner-led approach.
🤝 Help Us Grow This Circle
Thank you for reading and supporting Alpha with AI. If you share this edition with even one person who might find it valuable, it means the world to us and helps this project reach those who need it most.
Bonus Tool: Try the SuperAnalyst Command Centre (Basic)Free
If you’d like to take this even further, you can now access my SuperAnalyst Command Centre, Basic Version absolutely free.
It’s a conference call analyzer built for analysts, students, and investors who want to:
Decode management tone and intent in minutes
Run prompt templates for quarterly results & management commentary
Generate AI-based summaries with sentiment and guidance signals
Standardize how you analyze calls across multiple sectors
You don’t need to build anything, it’s ready to use.
👉 Access here: SuperAnalyst Command Centre (Basic Version)
(Includes all core prompts and AI templates I personally use during every results season.)
Our New Youtube Drop
At Shikshan Nivesh, our goal is simple, to make financial research faster, smarter, and more accessible.
Because the future of analysis isn’t about who knows Excel best.
It’s about who builds thinking systems that scale.
Written by Shubham Borkar | Research & Insights by Shikshan Nivesh AI Team
Financial Clarity. Insightful Ideas.
My other notable tools:
Disclaimer
This Guide & Prompt Kit and its outputs are for educational and research purposes only. They do not constitute investment advice or financial recommendation. Always verify disclosures and consult qualified professionals before making investment or business decisions.
Links & Follow
Thank you for being part of the Shikshan Nivesh community.
▶️ For video explainers on AI, finance, and smart investing, subscribe to our YouTube channel Alpha with AI
💬 Join our WhatsApp community for regular updates on finance, AI, and smart investing tools.
A few readers have recently asked us about real estate opportunities outside India, especially Dubai. Ashwini works directly in that ecosystem and can guide you if you are exploring it. Her WhatsApp link is included in case you wish to connect.


