


I do not trade options anymore.
I used to. During COVID I traded them heavily, and if I am honest, my start was earlier and worse. Before my MBA I traded options without understanding how they worked. I sometimes made money. I understood nothing. Most of the options market still trades exactly like that, on greed and no understanding, and I do not think that will ever change.
New here? Alpha with AI is not a stock ideas publication. Each edition builds a complete research system around one specific research job, insider activity, post-earnings research, working through filings, and shows how to do that job with AI end to end, with the exact prompts included. You take the system and run it on your own names.
the annual plan is 30% off for a limited time.
The MBA taught me the machinery. Theta, delta, how these contracts actually price. I carried that straight into my job as an equity dealer on a broking desk for wealthy clients (the dealer is the person who actually advises and places the trades).
At my peak I was handling 450 client portfolios. Thirty to thirty-five of those belonged to serious derivative traders.
I worked on that desk for only two years, but the experience packed into them felt like ten or twenty. I had no personal life. Weekends went into learning, and the relationships that mattered to me paid for it. I am not recommending that trade. I am telling you about it because everything I actually know about options came from those clients.
They ran from 25 to 85 years old.
One was in his seventies, an entrepreneur with a business worth more than a billion dollars, and on the side one of the most successful option short sellers I have ever seen. Another was 27, a second generation entrepreneur, already trading very successfully. And there was a money market dealer, somewhere in his forties, who panicked every single day. Every morning he called four or five different dealers and analysts for opinions, and it did not matter whether the person had six months of experience or twenty years. His voice always sounded the same. Shubham, what do I do? What do you think? He was one of the most successful traders I served anyway. In between sat sellers who treated options as risky free money, hedgers, adrenaline traders, and people whose entire income came from the market. Many could not have explained what an option actually is. They just knew it made money.
I talked to these people every day, sometimes on weekends. Slowly I worked out that the successful ones shared the same few traits, even though they came from completely different fields and generations. It took me much longer to admit that those traits were missing in me.
My clients’ derivative books did well. My own did not. With client money there was a sense of responsibility. The risk stayed measured, and the difficult decision got taken immediately, without waiting. With my own money, emotions arrived, the risk grew, and the difficult decision waited. After enough losses, I accepted what that meant.
I stopped trading options. That was almost a year ago.
The trader in me is probably gone. The opportunistic gambler is still alive. Two or three times a year I take a leveraged futures position on a company I have very high fundamental conviction in, using my long term holdings, pledged, as the margin. The rest of the time I wait. Two months, four months, sometimes more than six, with no position at all. The itch to take a position arrives every week, sometimes every day. Controlling that itch, ignoring it, and then continuing to ignore it until an opportunity arrives on one of my watchlist stocks that is genuinely too big to ignore, is the single most difficult thing I do as an investor. The waiting is not something I have to force anymore. It is something I just do.
What remained under all of this was what I have always been, a fundamental investor. When I study a business I look at three things: what goes in, the revenue model, and what comes out. The inputs a company buys, the way it turns them into money, and the products or services that leave the door. That is the basic case study of any business. And for years I have believed that only two things decide long term returns, valuation and earnings growth. I still mostly believe that.
That belief gave me a comfortable reason to ignore the options market on the stocks I own. Whatever kind of week the options are having on a company, the price will eventually follow the earnings. So why look.
Options are not only for trading.
The positioning on a stock you hold carries information about that stock, and some of the people paying for that positioning know things you do not. Their positioning is public. Volume (how much traded today) and open interest (how many positions are still standing) print on every contract, every day, where anyone can read them. For most of my investing life, checking that daily was a full time job that belonged to someone else. In 2026, AI can do it in minutes a day. Ignoring it because long term investing does not need options felt reasonable for years. With AI in the picture, it is closer to being ignorant, and the cost is real alpha left on the table. Half a percent here, one percent there, sitting in things a machine can monitor while I read filings.
So, almost a year after I stopped trading options, I opened Claude Code and started building an options screener. What I wanted from it had nothing to do with trading.
A small warning before we go on. This edition is a little more technical than my usual ones. Every term gets explained in plain words as it appears, and if you have never touched an option in your life, that is fine. I wrote this for you too.
What the options market can tell you about a stock you already own
I call the tool the disagreement detector, and its job is one question: is the options market disagreeing with me about a business I own?
Every options tool I have come across is built for trading. Scanners that hunt the whole market for unusual activity, alert services that push the day’s biggest prints (a print = a trade that showed up in the data), all of it built to answer what should I trade today. I have no use for that question. I hold my companies for years, and I have no intention of trading a single option on any of them.
But I do care when someone starts paying serious money for a view that contradicts mine. A stock position is mostly silent. You cannot see who is accumulating shares against you until a 13F (the quarterly holdings report large fund managers must file) shows up, forty five days after the quarter ends, and even then only for the largest managers. An option is louder. Every option names the price level the bet turns on (the strike), the date the bet expires, and the real money paid up front for it (the premium), and the exchange publishes the volume and open interest on every contract, every day, for free. When positions like that appear on a company I own, persist, and keep growing, I want to know about it.
So the disagreement detector does not scan the market. It watches sixteen names: the businesses I own or cover, plus the kind of quality companies I would want to own one day. Every morning it takes a snapshot of the full options chain on each of them (the chain is the list of every option contract that trades on a stock) and writes me a short report. I call that output the disagreement report. Most days, for most names, the report says the same thing: quiet. Quiet is a finding. It means nobody put meaningful new money against my read that day.
And when the report is not quiet, the flag is a question, never an instruction. The detector surfaces what changed on which name and what to investigate. It does not tell me what to do about it, and nothing in this edition tells you what to do about anything either.
One honest caution before we go further. Most unusual options activity is not information. It is hedging, rolling, expiry mechanics, or a volatility trade with no view on direction at all. A tool like this earns its keep not by finding flags but by killing them. Hold that, because the killing is where this build gets interesting.
First, what it is built from.
How to build an options screener with free data and Claude Code
The build had one rule: free data only.
The professional version of this problem runs on paid data feeds. I wanted to know how far free public data could go before I paid anyone for anything. I ended up with three sources, and one honest gap.
Cboe, the options exchange, publishes the full delayed chain for any US ticker as a single file a machine can read: every contract, its volume, its open interest, the last trade, the bid and the ask. About fifteen minutes behind the market, free, no account, no paywall.
SEC EDGAR publishes insider filings. When an executive or a director trades their own company’s stock, a Form 4 must be filed within two business days, and the form carries a detail most people skip: a checkbox showing whether the trade ran under a pre-scheduled plan. Scheduled selling is near-noise. A discretionary trade is a decision somebody made that week.
The House of Representatives publishes its members’ trades, up to forty five days after the trade, as PDF filings. This is the ugly corner of the pipeline, and it is exactly where Claude Code earns its keep: it reads the PDFs and pulls the transaction rows out. About one in ten is a scanned image a computer cannot read cleanly. The tool counts those and says so, instead of pretending they do not exist.
The honest gap is the Senate. Its disclosure site turns away automated requests, so version one is House only, and every daily report states that in its header.
Then came the constraint that shaped the whole design. Free end-of-day data has no trade tape. I cannot see whether a trade hit the bid or the ask, and I cannot see sweeps, the aggressive multi-exchange orders that flow services are built around. So this tool does not pretend to. It asks three slower questions instead.
Did volume show up today far above the open interest that existed yesterday, which means positions were opened, not managed?
Is open interest growing day after day on the same contract, which means someone keeps paying to hold the position?
And is the balance of puts to calls (puts are bets on a fall, calls are bets on a rise) moving against this name’s own history, not against some other stock’s?
Slower suits me. A day trader needs the sweep the second it prints. A decade-holder needs to know whether somebody is still paying for a position against his thesis a week after they opened it. End-of-day data answers the second question fine.
The scan behind those three questions is plain arithmetic, and I am publishing the exact rules alongside this edition, in a public folder of files anyone can open. The floors: volume at least 2.5 times the standing open interest, at least 250 contracts, and roughly $200,000 of premium at stake before a contract even becomes a candidate, with smaller floors on thin chains so a quiet name like Solstice stays visible, and open interest growth of at least a thousand contracts across consecutive days before anything is called a build.
Every candidate then walks an exclusion ladder before it can be called a signal:
Expiring within three days: almost always rolls or expiry mechanics.
Earnings within about ten days: presumed hedging (buying protection, not making a bet), not information.
Matching call and put volume at the same expiry: a volatility trade, no direction in it.
Deep in the money with volume matching open interest: mechanics, not opinion.
The whole universe leaning one way on the same day: the market repricing, not news about my company.
The machinery runs itself. Every morning my machine snapshots all sixteen chains at the prior close, automatically, whether I am paying attention or not. The archive of those daily files is the dataset. None of it can be recreated later, which is why the snapshots started the same day as the idea. And here is the prompt, exactly as I run it, every morning:
run the tapeThat is the entire interface. Behind those two words sits a saved set of written instructions and a few small programs that Claude Code runs in order: take the snapshot, run the scan, pull the fresh Form 4s and the congressional PDFs, walk the exclusion ladder, and write the day’s disagreement report with every number traced to the snapshot file it came from. I described the design to Claude Code in plain English across two sessions on July 23, and it wrote those programs itself.
If you have never wired Claude Code up for investment research, I have walked through the full setup twice: How I Set Up Claude Code as My Investment Research Analyst is where to start, and the 2.0 edition is the same setup rebuilt 120 days later, as it runs today. Everything in this piece sits on that foundation.
What does a snapshot look like? Here is the first one on file, the July 22 close, exactly as it sits in my notes:
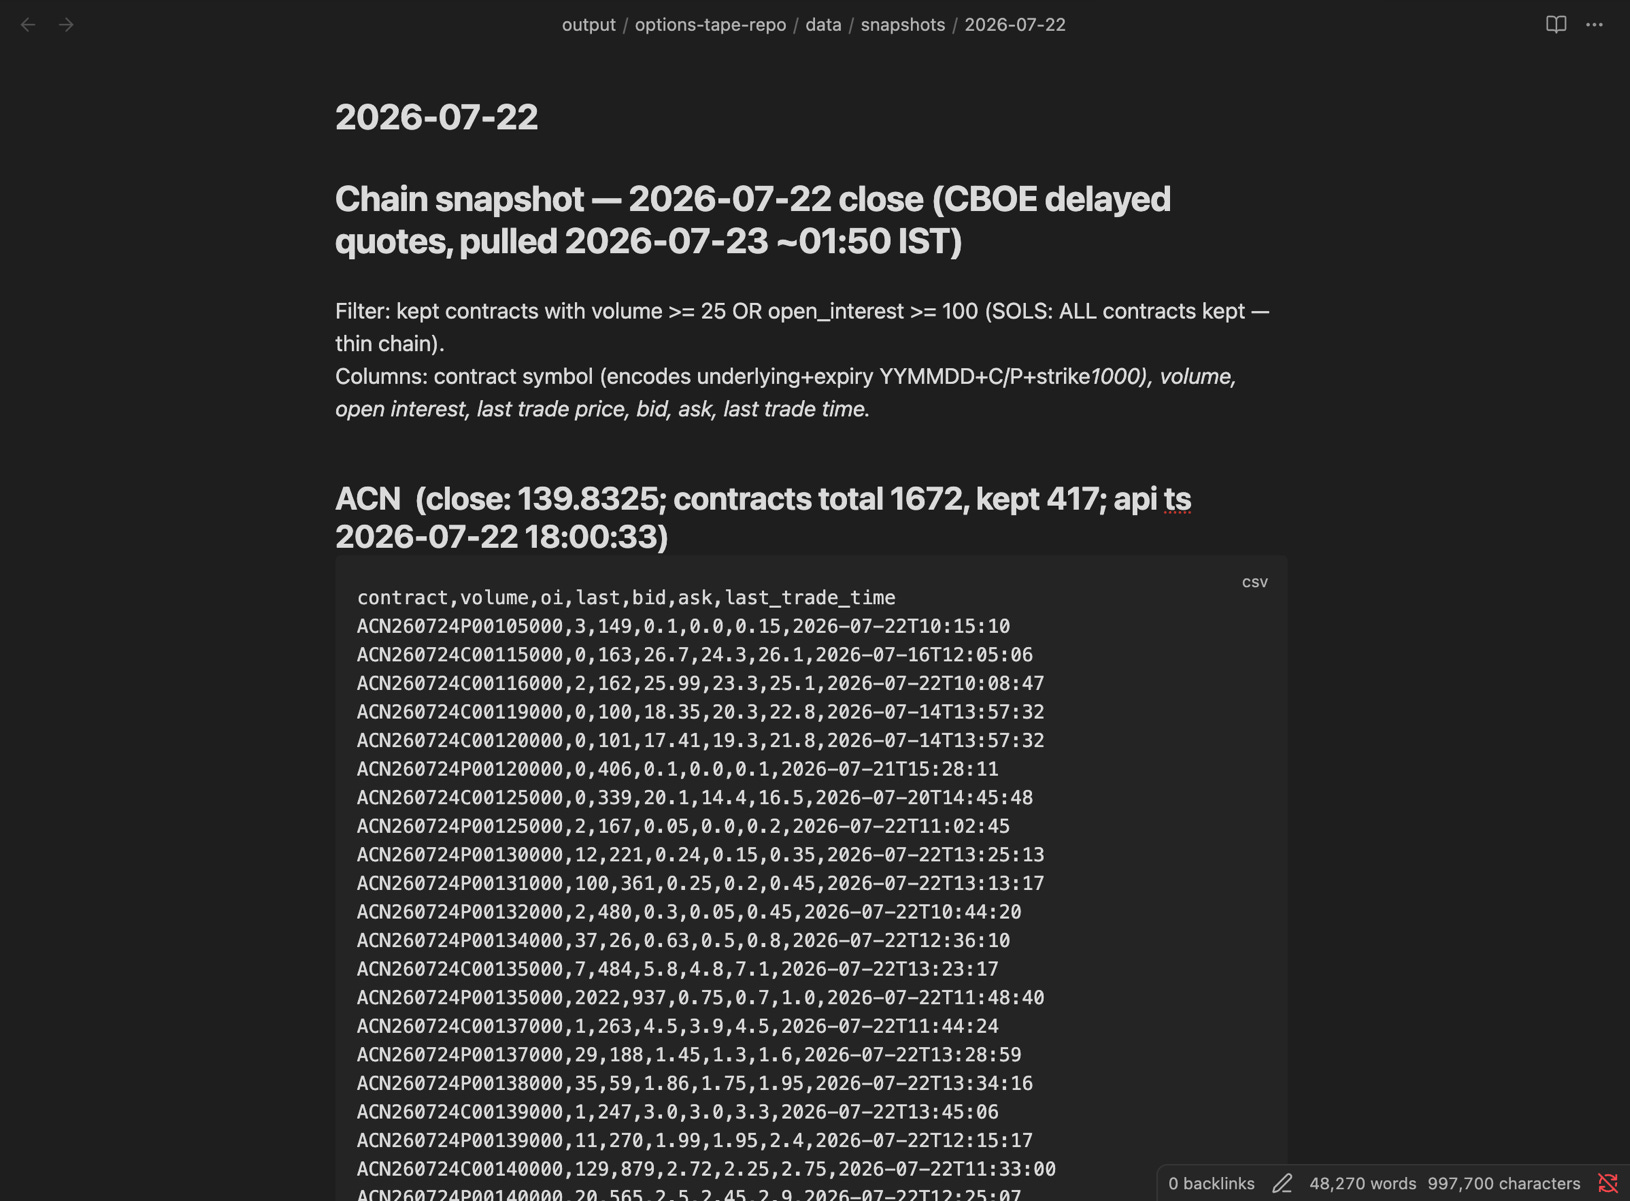
Nobody reads this raw. That is the point of the whole build.
None of this, so far, finds anything. It only produces candidates. What decides whether a candidate is real is a test that runs overnight, and that test is the best trick in the whole build.
The overnight test that separates real option positions from day trades
Free options data has one clean trick in it, and the whole tool stands on that trick.
Two numbers, both public. Volume counts how many contracts changed hands today. Open interest counts how many contracts people are still holding when the day ends. Think of volume as today’s activity, and open interest as the bets that survived the day. The exchange updates open interest overnight.
Here is why that matters. Say an option that barely trades on most days suddenly trades thousands of contracts. That looks dramatic. But the volume number alone cannot tell you which of two very different things just happened. Maybe somebody opened a big new bet and is holding it, with real money now riding on it. Or maybe traders bought and sold all day, and by the close nobody kept anything. Both look identical in the day’s volume. The difference shows up the next morning. If the buyers kept their contracts, open interest jumps. If open interest does not move, nobody went home with a position, and the drama meant nothing. So the tool never trusts a dramatic day on its own. It writes the candidate down, and the next day’s run checks it against the open interest that settled overnight.
One practical note on the rhythm. I run the tool once a day, after the US market closes. The data capture is separate and automatic: every morning my machine stores the snapshot whether I show up or not. So there is no second run and nothing waits on me. Today’s run scores today’s new candidates, and it also opens with a checklist, judging yesterday’s candidates against the open interest that arrived overnight. Every report literally ends by writing tomorrow’s checklist for itself.
The very first run showed me how well this works. On July 23 the scan flagged eight contracts across five of the sixteen stocks. Each one had far more volume in a single day than all the contracts that existed before it, which is what new bets being opened looks like. One night later, every single one showed up in open interest. The buyers had kept them. I call that conversion: the day’s volume converted into bets somebody is still holding. Four of the eight, straight from that morning’s report:
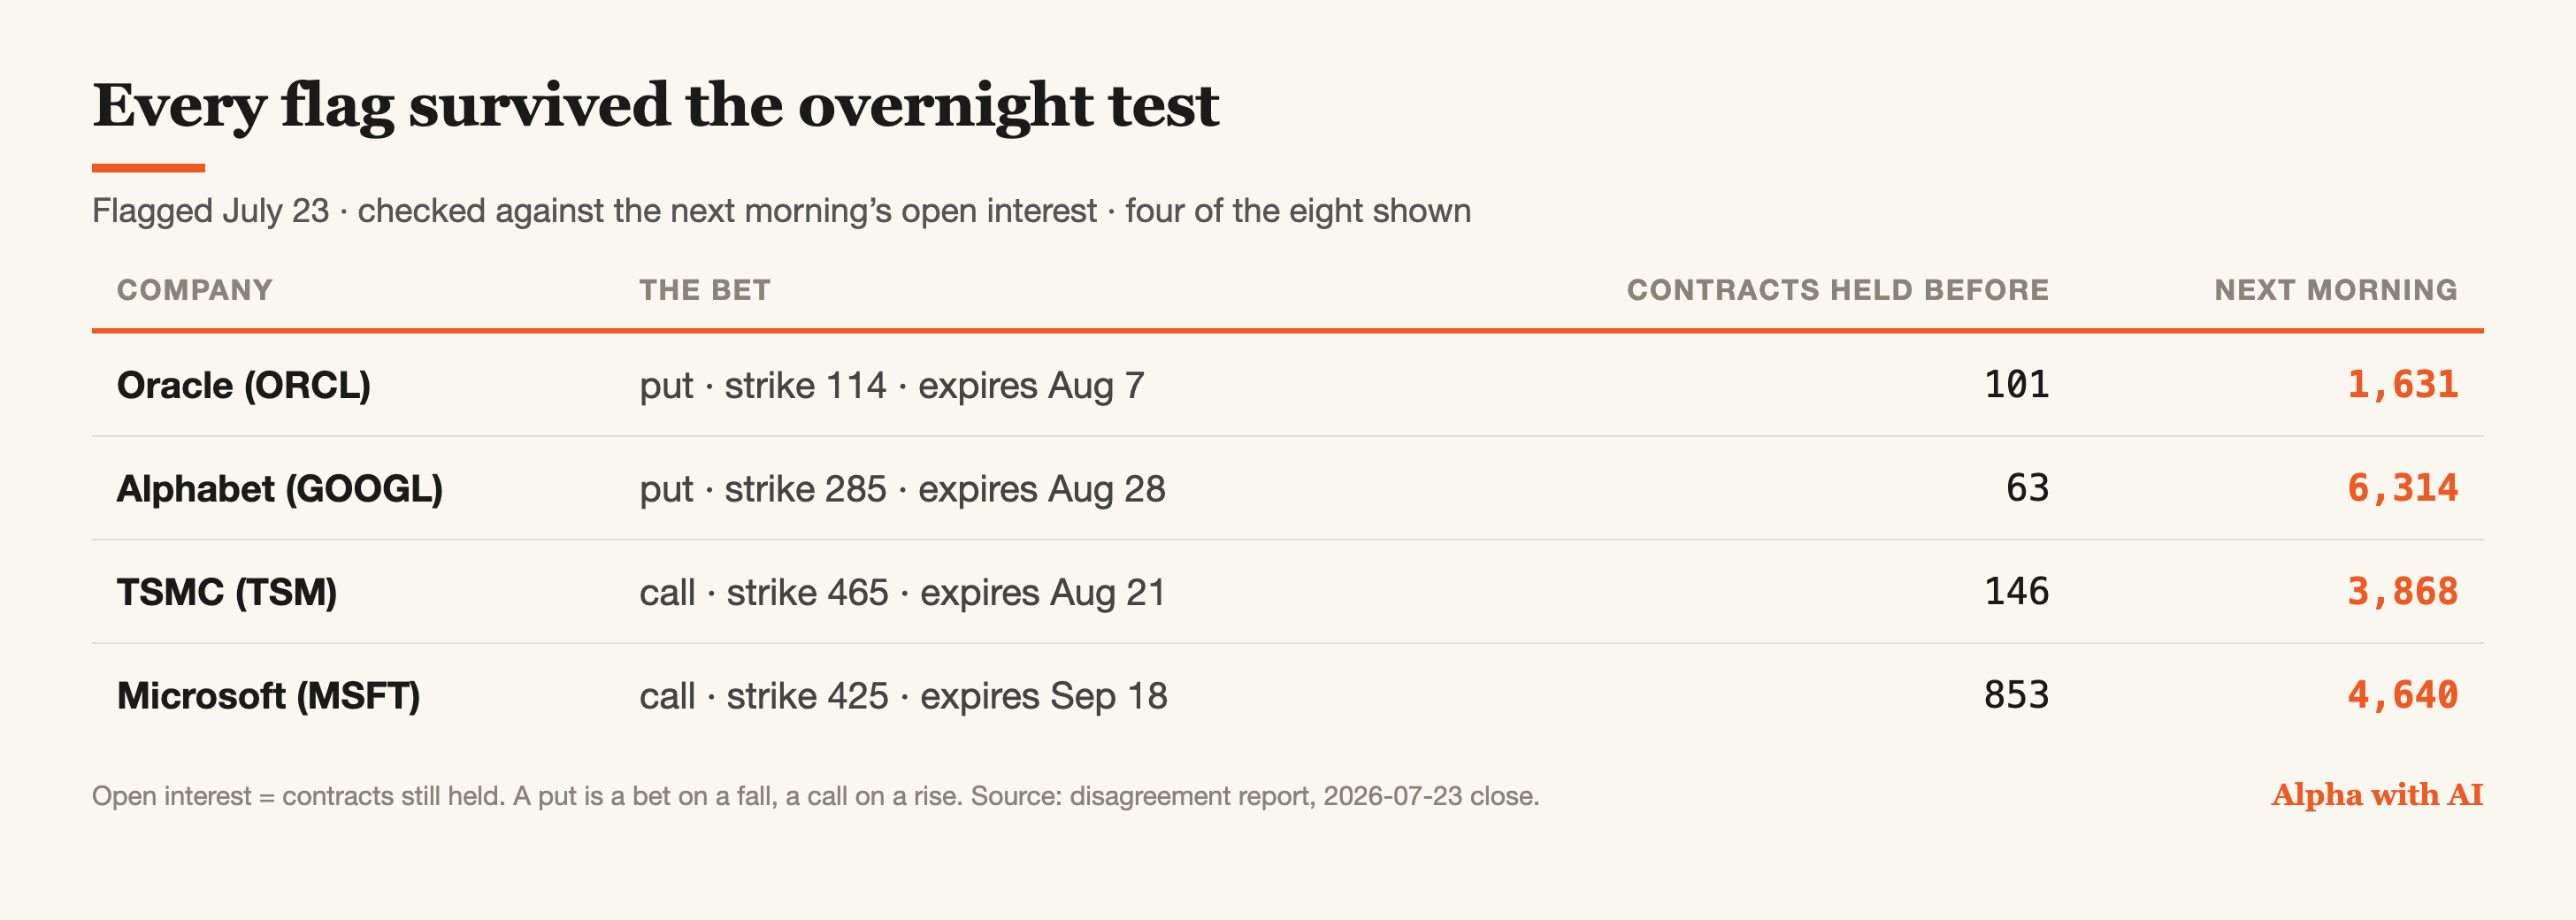
Even the smallest of the eight, a bet against Intuitive Surgical expiring in mid 2027, kept about 200 of its 299 traded contracts. Nothing flagged that day was a day trade. Real people had opened these bets and were paying to keep them.
Notice what the test proves and what it does not. Conversion proves a bet is real. It does not prove the bet is smart, informed, or right. A real bet can still be simple protection, or a mistake. The test answers only the first question: is somebody actually holding this view with real money, or was it noise?
When a stock’s bets pass that test, the tool scores the stock. I call it the divergence score, and it is nothing fancy. It runs from zero to ten and just adds up evidence. The same bet growing for three days in a row earns points. Large money earns points. Several bets in the same direction landing on one stock in a single day earn points. An insider of the company trading the same way earns points too, but only when it was their own decision, not an automatic selling plan. A newly disclosed trade by a member of Congress earns one point at most, and only as a look backward: those filings arrive weeks after the trade actually happened, so they can quietly confirm a picture, never lead it. Then the score loses points for the things that usually explain away the drama: earnings coming up, a bet about to expire, or similar money sitting on both sides of the same stock. Five or more means the options market genuinely seems to disagree with me about that stock. Three or four means keep watching. Less than that, it just gets written down.
One caution I repeat in every report: the scoring is a hypothesis, not a proven system. Eight trading days of data is a start, not a track record. The tool writes down every scan, including the boring ones, exactly so the scoring can be tested against reality later instead of being trusted on faith.
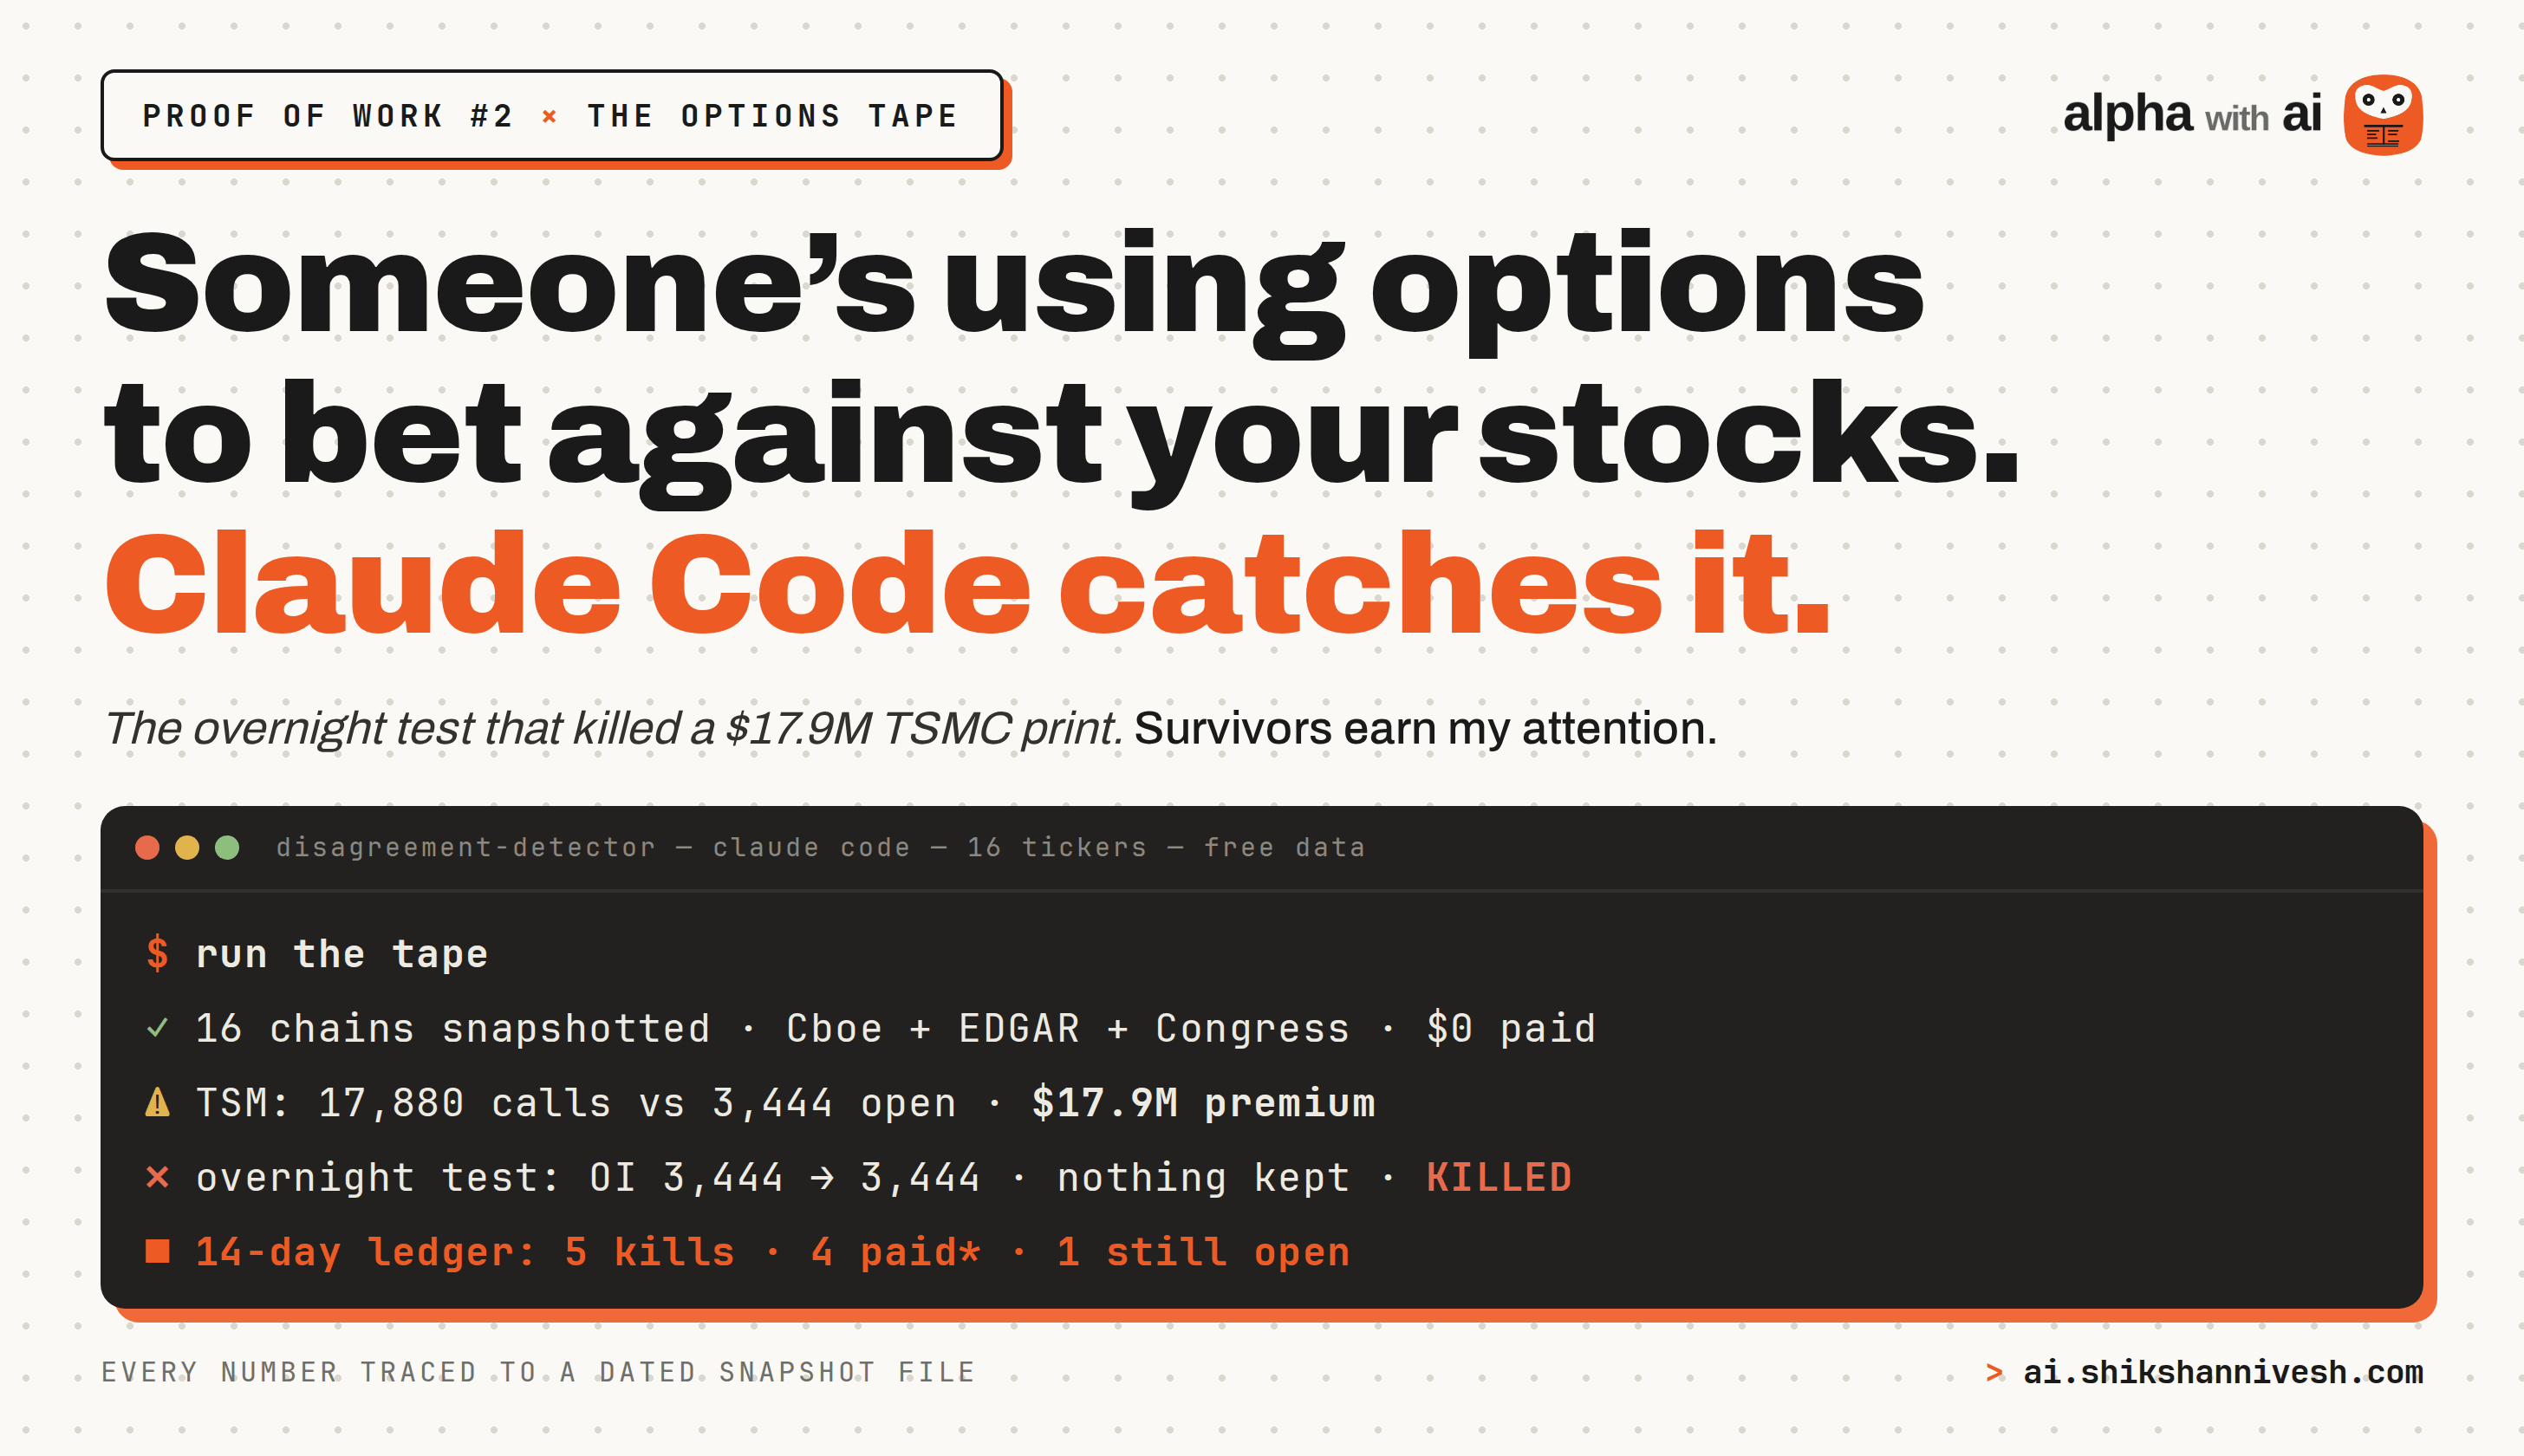
The overnight test, though, needs no faith. A bet either stands the night or it does not. By the end of week two the test had killed five flagged candidates, including the biggest one-direction bet the tool had seen in the whole project: $17.9 million of buying on one stock, gone by morning.
That story is next.
Why unusual options activity is usually not a signal
On Tuesday July 28 the tool flagged the most dramatic thing it had seen. Somebody traded $17.9 million worth of bets that TSMC, the Taiwanese chipmaker, was about to rise.
The details made it look like serious money moving on serious information. The bets were call options: contracts that pay if TSMC climbs above 450 by mid September. 17,880 of them traded in one day, on a contract where only about 3,400 existed the day before. The stock had fallen 6.9% in a week, so someone appeared to be betting big on a bounce. Earnings were nowhere in sight, TSMC had already reported on July 16, so this was not the routine protection you see before results. And a second large bet sat right beside it: $3.25 million more, on a climb above 530. If you subscribe to any options alert service, this is exactly the kind of thing that arrives as a push notification implying that smart money knows something.
The disagreement report logged it, scored it 4 out of 10, and put one line on the next morning’s checklist: check whether the TSMC buyer kept the position.
The next day’s run opened that checklist. The count of contracts people were still holding: unchanged. 3,444 before, 3,444 after, even though 17,880 had traded in between. The second bet: unchanged too. Whoever traded roughly $21 million of TSMC bets that day bought and sold everything within the same day and kept nothing. The most dramatic bet of the whole project produced zero standing positions. The next day TSMC fell 4.5%.
Two days later came the punchline. TSMC jumped 7.6%. If that dead bet had been real, it would have paid handsomely. It was not there to collect. I wrote that down too, because the ledger records what happened, not what makes the tool look good.
By the end of week two the overnight test had killed five candidates:
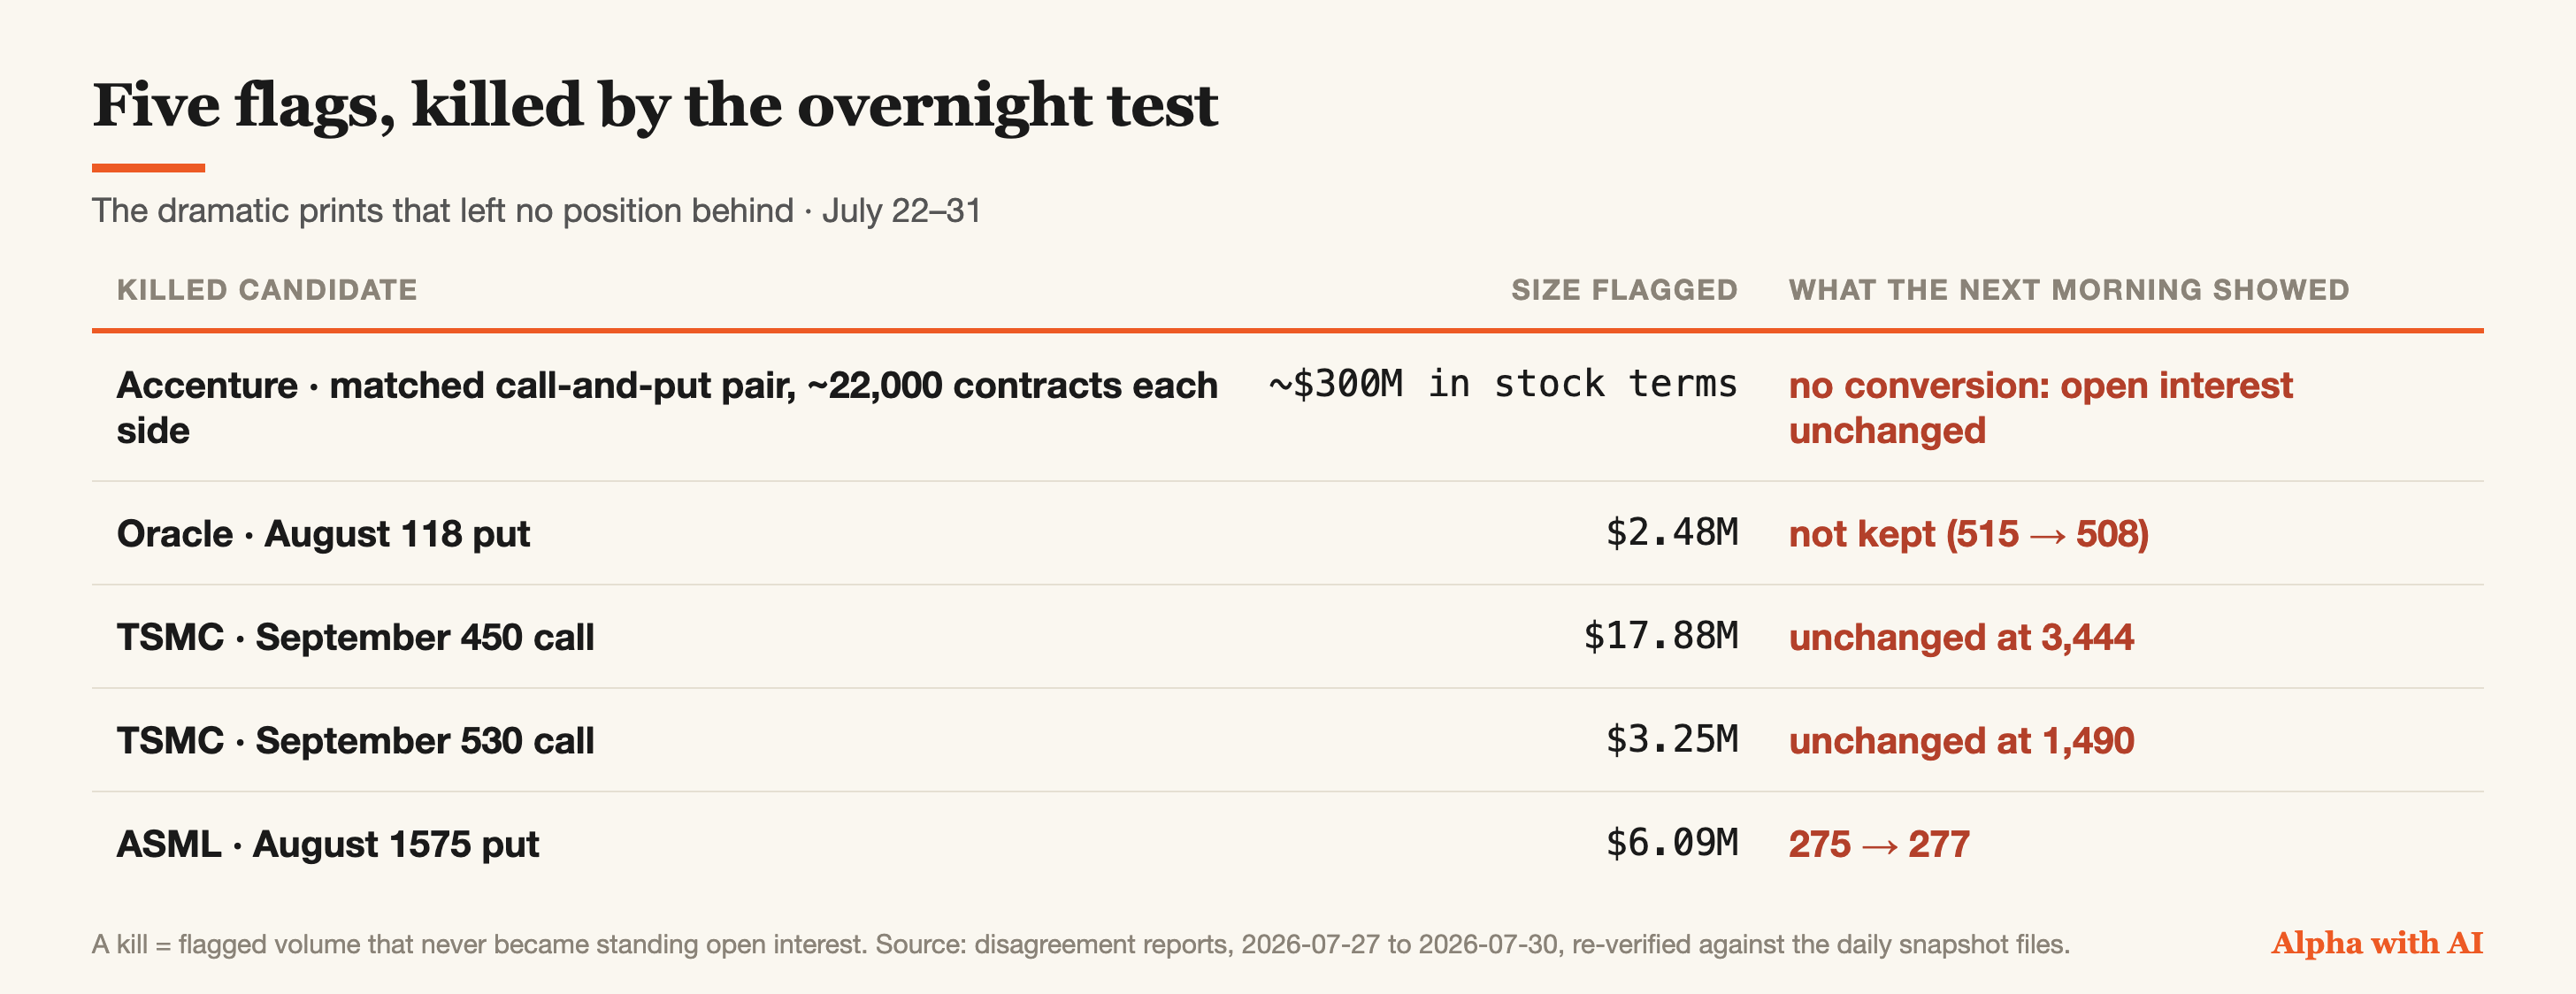
The Accenture row deserves its own story, because Accenture is a stock I actually own, and because this kill humbled me twice in one week.
I researched Accenture earlier this year, so when the tool caught something enormous on it on July 23, I read that report more carefully than the others. What it caught: about 22,000 contracts betting on a rise and another 22,000 betting on a fall, landing the same day, expiring the same month. For scale, all the standing Accenture option contracts in existence totaled around 207,000, so one day of activity matched a fifth of everything that existed. If you turned those contracts into stock, they would control roughly $300 million worth of Accenture shares. Somebody very large had done something deliberate on my company, and I could not tell what.
The next day Accenture jumped 5.95%.
Be honest, you would have connected those dots too. Mystery trade lands Thursday, stock explodes Friday, the options market knew. I wanted to write that sentence. It is a flattering story. The report refused to let me, for a boring reason: end-of-day data cannot show who was buying and who was selling. The exact same trades could be a bet that Accenture would rise, or someone protecting a large holding against a fall. Both leave identical marks in the data. Unknowable, said the report. Check Monday’s open interest.
Monday’s answer: nothing. Both sides unchanged. Some forty four thousand contracts had traded and left no position behind, which means old positions were closed out or traders went in and out the same day. Not new money. The most cinematic trade of the project was dead, killed by the tool’s own test.
And then Accenture kept going anyway. Up 11% in two sessions. Up 18.7% in three. Up 24.8% in four. The reasons turned out to be plain fundamentals: a bigger share buyback, a dividend, AI related contract wins, and the whole IT services sector rallying together. None of that was ever in the options data. The tool had nothing to do with the rally and said so in writing. That is the second humbling, and the more useful one: sometimes the reason a stock moves was never in the options data at all. A screener that never kills its own ideas is just a tip sheet. This one killed the two most dramatic things it saw inside a single week, and that discipline is the only reason to believe it when it does flag something.
Because it did flag things. In the same two weeks, four flagged bets went on to pay, one of the tool’s cleanest signals expired worth nothing, and one disagreement is still open right now, against a stock that keeps rallying against it. The rest of this edition is that ledger, every number traced to its file.
If you know one investor who pays for options alerts, send them this section. It is the half of the story alert services do not show.