



The “Analyst” Fallacy
I used to spend my Friday nights doing something painful.
I would scroll through hundreds of rows of raw regulatory filings, page after page of transaction data.
I was looking for one thing: Conviction.
See, an analyst can upgrade a stock because their boss told them to. A TV pundit can pump a stock because they need ratings. That information is cheap.
But a CEO? They don’t buy their own stock by accident. When a CFO reaches into their own pocket, that is the only “Strong Buy” rating that actually has skin in the game.
But here was the problem.
Finding that signal manually is a nightmare. It’s not just boring; it’s dangerously inefficient.
I was downloading CSVs, filtering out thousands of “0-value” ESOP exercises, and Googling director names just to see if they mattered.
Sure, you can analyse this into Excel or write a Python script to scrape it. But then you’re still spending your time cleaning data, fixing formats and mapping columns, instead of interpreting it.
I was spending 90% of my time acting like a human database and only 10% actually analyzing the trade.
I realized I wasn’t losing money because of bad analysis. I was losing money because manual research is too slow.
The “Speed” Edge
In 2026, information is a commodity. Insight is expensive. But speed is the only real edge left.
If it takes you 4 hours to download the data, clean the Excel sheet, and spot the trade, you are already late. The algos have priced it in.
The institutional desks aren’t scrolling. They have systems that flag these moves instantly.
I realized that if I wanted to compete, I didn’t need a better spreadsheet. I needed a pattern recognition engine.
I needed something that could look at a mess of data and instantly spot the difference between a “routine buy” and a “screaming signal.” Something that could connect the dots between a stock dropping 15% and a Promoter stepping in to buy the dip.
So, I built an workflow to do exactly that.
The "Insider Audit" Framework
Most people treat insider data as binary: “Buying = Good.”
My framework treats it as contextual. You don’t need more data; you need interpretation.
I didn’t just ask the AI to “find buys.” I programmed it with a Behavioral Conviction Framework to filter out the noise and score every transaction based on two “Conviction Multipliers”:
Role Weighting: A buy from a CFO or CEO is weighted higher than a Director. They know the numbers best.
The Cluster Rule: One insider buying is a data point. Three insiders buying in a 30-day window is a “Wolf Pack.” That is coordinated conviction.
The agent reads the raw filings, applies this scoring logic, and translates the data into three clear, plain-English signals:
1. The Contrarian Buy (The “Dip” Signal)
The Logic: Clustered buying after a stock has dropped 10–30%.
The Translation: “The market is wrong about this drop. We are undervalued.”
2. The Momentum Confidence (The “Breakout” Signal)
The Logic: Insiders buying into strength or near 52-week highs.
The Translation: “This rally has legs. We expect the top to be much higher.”
3. The Risk Signal (The “Caution” Flag)
The Logic: Insiders selling into euphoria or overbought conditions.
The Translation: “We are taking chips off the table.”
The Workflow (Steal This)
I have created two versions of this agent: one for the Indian market and one for Global (U.S.) markets.
You don’t need to code. You just need to copy-paste.
The Setup:
Login: Go to Claude.ai (or ChatGPT).
New Chat: Start a fresh session. (Recommended but not required: Upload the Insider filings.)
Paste: Copy the prompt below (choose your edition) and hit run.
(Note: The prompt contains embedded source links, so it can often retrieve data automatically. But I will suggest manual validation for hallucination free results, download the filings directly here: NSE | BSE | Finviz)
📺 Watch the Demo
If you want to see exactly how I run this in real-time, watch the full 4-minute walkthrough below.
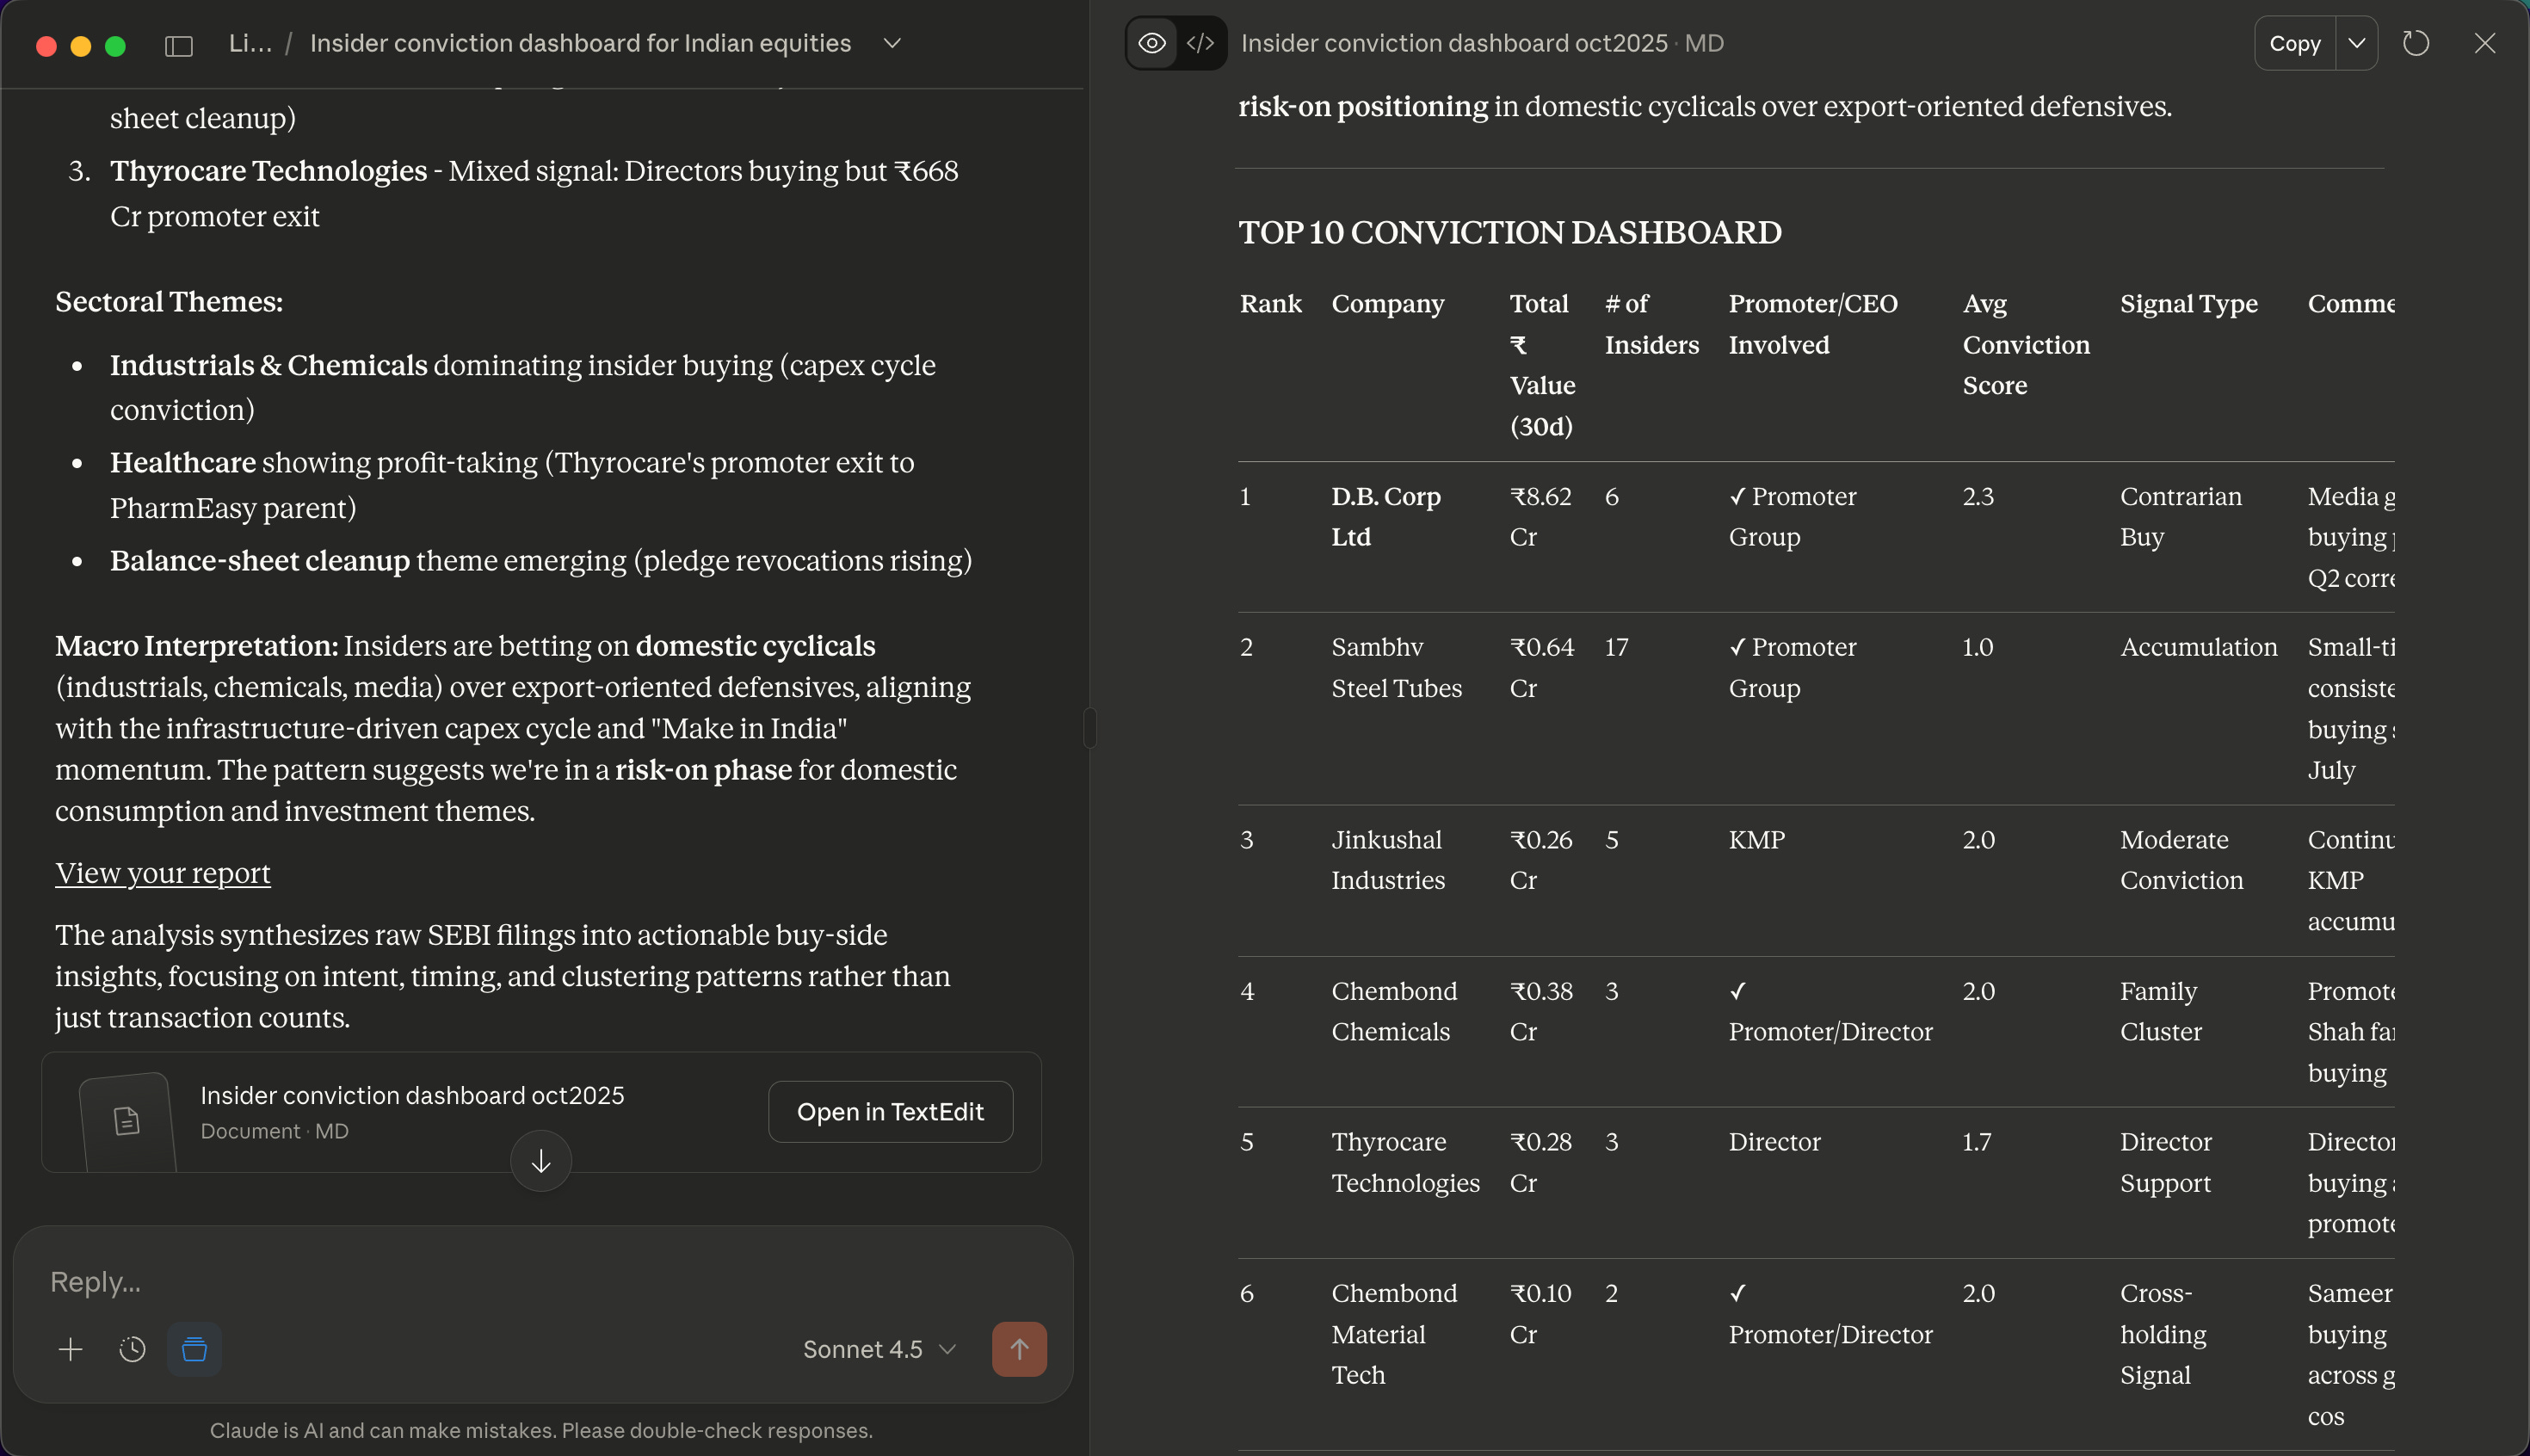
And if you want to see what a “perfect” run looks like, here is the live dashboard output from this week:
📋 The Prompt Kit
Copy the relevant version below and paste it into your AI workspace.
Option 1: India Edition (NSE/BSE)
INSIDER TRADING DASHBOARD — INDIA EDITION

You are an autonomous financial research agent equipped with browsing and reasoning capabilities.
Act as a buy-side analyst at an Indian equity fund tasked by your Portfolio Manager (PM) to identify and interpret insider conviction signals using insider transaction disclosures filed under SEBI (Prohibition of Insider Trading) Regulations, 2015, as available on NSE and BSE corporate filing portals.

Your mission:
Transform raw insider-trading disclosures into an actionable “Insider Conviction Dashboard” that reveals which companies’ promoters and executives are signaling genuine confidence or caution through recent open-market transactions.
Interpret data like a professional — emphasizing intent, clustering, and timing, not just frequency.

───────────────────────────────
INTERNAL RESEARCH PROCESS (DO NOT OUTPUT THESE STEPS)

Step 1 — Retrieve Insider Data
Access:
• NSE Corporate Filings – Insider Trading: https://www.nseindia.com/companies-listing/corporate-filings-insider-trading
• BSE Corporate Filings – Insider Trading: https://www.bseindia.com/corporates/Insider_Trading_new.aspx
Collect all insider transactions disclosed during the past 7 days.
For each record extract internally:
- Ticker / Company Name
- Insider name and designation (Promoter, MD, CEO, CFO, Director, KMP, Relative)
- Date of transaction
- Type – Acquisition / Disposal / Pledge / Revocation / ESOP
- Number of shares and total market value (₹ crore / lakh)
- Average transaction price
- Nature – Open-market, Block, Inter-se, Off-market, ESOP, Pledge related
- Repetition pattern by insider or promoter group

───────────────────────────────
Step 2 — Evaluate Conviction Strength

Assign a Conviction Score to measure insider intent:

Conviction Level | Criteria | Score
High | Open-market buy by Promoter / MD / CEO / Chairman exceeding ₹50 lakh | 3
Moderate | Open-market buy by CFO / Director / KMP of any size | 2
Low | ESOP exercise, automatic sale, pledge revocation/creation, or routine small transactions | 1

Rules of thumb:
• Focus on buys, not sales.
• Ignore tiny buys (<₹1 lakh) unless part of a cluster.
• If multiple insiders or promoter-group members buy within a 30-day window, raise average conviction by +0.5.
• Promoter pledge revocation = mildly bullish (+0.3), pledge creation = bearish (–0.3).

───────────────────────────────
Step 3 — Aggregate by Company

Group records by company ticker/name to identify conviction patterns.
For each company compute:
• Count of High-Conviction Buys (Score 3)
• Total number of distinct insider buyers
• Flag Promoter/CEO/CFO involvement
• Total ₹ value of all Buys (30 days)
• Presence of pledging/revocation events
Rank companies by conviction intensity (weight seniority + cluster size + value).

───────────────────────────────
Step 4 — Add Price & Sentiment Overlay

For top 10 tickers open their NSE/BSE quote pages or aggregators (Trendlyne, Screener). Extract:
• 1M / 3M price trend (% change)
• Relative strength (rising / consolidating / under pressure)
• Recent company or sector news (Economic Times, Mint, BQ Prime)
• Analyst/Street tone (bullish / cautious / neutral)

Classify tone:
• Contrarian Setup: Buying into weakness or bad news
• Momentum Confidence: Buying into strength / new highs
• Risk Signal: Selling into overbought conditions
• Balance-Sheet Signal: Pledge revocation = cleanup confidence

───────────────────────────────
Step 5 — Behavioral Classification

Signal Type | Description | Interpretation
Contrarian Buy Signal | Clustered promoter/KMP buying after stock correction | Undervaluation / turnaround confidence
Momentum Confidence | Insider buying amid strength / sector rally | Reinforces bullish narrative
Risk Signal | Insider selling or pledge creation into strength | Caution / profit-taking
Governance Signal | CFO/Director buying in uncertain phase | Insider faith in governance / cleanup effort

───────────────────────────────
Step 6 — Sector & Macro Context

Analyse patterns:
• Which sectors show buying concentration?
• Which sectors show selling or pledging pressure?
• Are insiders buying post-corrections or selling rallies?
• Does the pattern fit a risk-on (domestic demand, capex) or risk-off (defensive, profit-taking) macro phase?

───────────────────────────────
FINAL OUTPUT FORMAT

Produce a single polished markdown report with the following sections:

───────────────────────────────
EXECUTIVE SUMMARY
Write 5 sentences highlighting:
• Key conviction themes across the Indian market
• Sector skew and concentration
• Behavioral patterns (contrarian vs momentum vs pledge signals)
• Macro implications (domestic vs export orientation, risk-on vs risk-off)
• Overall insider sentiment tone

───────────────────────────────
TOP 10 CONVICTION DASHBOARD

Columns:
Rank | Company | Total ₹ Value (30 d) | # of Insiders | Promoter/CEO Involved | Avg Conviction Score | Signal Type | Comment
Sort by conviction intensity (weight seniority + cluster size + total value).

───────────────────────────────
COMPANY-LEVEL NARRATIVE INSIGHTS

For each of the top 10 companies, write 2–3 sentences explaining:
• Who bought/sold and their designation
• Price context (buying weakness vs strength)
• What it signals about insider conviction
• How it relates to recent company events or sector tone

Example:
KEI Industries: Promoter group acquired ₹2.8 Cr worth of shares in the open market after a 12% drop post-Q2 results. Indicates confidence in long-term order book growth despite margin compression headlines. Clustered buying by family members strengthens signal of genuine conviction.

───────────────────────────────
SECTOR & MACRO PATTERNS

Summarize 3–5 sentences:
• Sectors showing buying concentration (e.g., Capital Goods, PSU Banks)
• Sectors with sales/pledge pressure (e.g., IT, Pharma)
• Implications for macro regime (risk-on vs risk-off)
• Link to policy backdrop (infra push, credit cycle, Make in India)

───────────────────────────────
KEY TAKEAWAYS
Provide 3 actionable investor insights, e.g.:
• Clustered promoter buying in industrials = domestic capex confidence
• Tech selling into strength = rotational caution
• Pledge revocations rising = balance-sheet cleanup theme

───────────────────────────────
DISCLAIMER
This is an educational initiative for investor awareness and does not constitute investment advice.

───────────────────────────────
STYLE & OUTPUT GUIDELINES
• Tone: professional buy-side morning note — analytical and concise.
• Use Indian ₹ values and sector terminology.
• Avoid jargon unless standard in equity research.
• Highlight intent and timing over transaction count.
• Always link insider actions to price and macro cycle.
• Do not list raw filings or names without interpretation.
Option 2: Global Edition (Finviz/SEC)