



I used to think that being a “Top Advisor” was about how much data I could handle.
I spent years believing that the more research reports I read, the better my advice would be.
At the time, I was managing and advising on significant HNI portfolios. The pressure was high. My clients wanted answers on thousands of different stocks, and my solution was always the same: Read more.
At that level, you aren’t the one building the 30-tab financial models. You are the one who has to make sense of them.
My research team would hand me a stack of reports on 300 different companies. They spent weeks on the assumptions, the DCFs, and the price targets.
But I only had 30 minutes to decide if their “conviction” was real or just accounting noise.
I was proud of the “grind.” I thought the solution to finding alpha was to read more reports, track more price targets, and dig deeper into my team’s assumptions.
But I was trapped in the “Hardworking Executive” cycle.
I was trying to achieve more by doing even more.
One afternoon, I hit a wall.
I was staring at a sector with dozens of “Buy” ratings from my team, trying to find just one high-conviction “Moat” that would actually survive a 2-year downturn.
I had 10 terminal windows open, 5 reports half-read, and zero clarity.
I realized I wasn’t being wise. I was just being busy.
In the age of AI, the hardworking person drowns because they use technology to “summarize more.”
The wise person wins because they use technology to eliminate more.
A wise researcher doesn’t look for more data to support a story. They look for the 90% of institutional noise they can safely ignore so they can focus on the 10% of structural truth.
I had to stop “deciding” on stories and start “filtering” for Economic DNA.
The Signal and the Noise
Most investors look at a high-growth market and think the hard part is over.
They believe that if they just follow the “Buy” ratings in a 20-page PDF from a research team, their capital is safe.
But they are looking at the wrong side of the ledger.
In 2026, P/E ratios and revenue targets are just “table stakes.” They are noise.
The real alpha is hidden in Capital Intensity, the structural DNA of how a business actually converts that growth into cash.
Traditional research coverage is dying because it is too slow to catch these nuances.
If you are a Senior Researcher, you know the truth: Most analysts spend weeks building beautiful models, but they miss the moment a Moat begins to leak because they are drowned in their own data.
Whether you are looking at the NSE or the NYSE, the reality is the same:
If you are still relying on human-only summaries to understand a business model, you are fighting a 2018 war in a 2026 market.
To protect your capital and the integrity of your research thesis, you don’t need a team of 50 people making more assumptions.
You need an elimination tool for decision-makers who don’t have the time to be factory workers.
You need a way to audit the structural quality of an entire sector in minutes, not weeks.
You need to move past “what the model says” and find the Economic DNA.
The 3-Step Selection SOP
To move from “Data Noise” to “Institutional Insight,” I use a three-step funnel.
The goal isn’t just to find a “Buy” rating. The goal is to eliminate 95% of the market so you can focus your intellectual capital on the 5% that actually matters.
Step 1: The Macro Filter (The “Why Now?”)
Before looking at a ticker, you must look at the structural environment. A wise researcher identifies the “Growth Pillars” that have government tailwinds or massive capital shifts.
Example Case Study (India): Right now, we see structural shifts in Digital Infrastructure and High-End Manufacturing. These aren’t just “trends”, they are foundational changes in the economy.
The Goal: Eliminate sectors where growth is cyclical (temporary) and focus on where it is structural (long-term).
The Methodology: I recently shared a full framework on Using AI for Industry Research that helps you automate this macro filtering process in minutes.
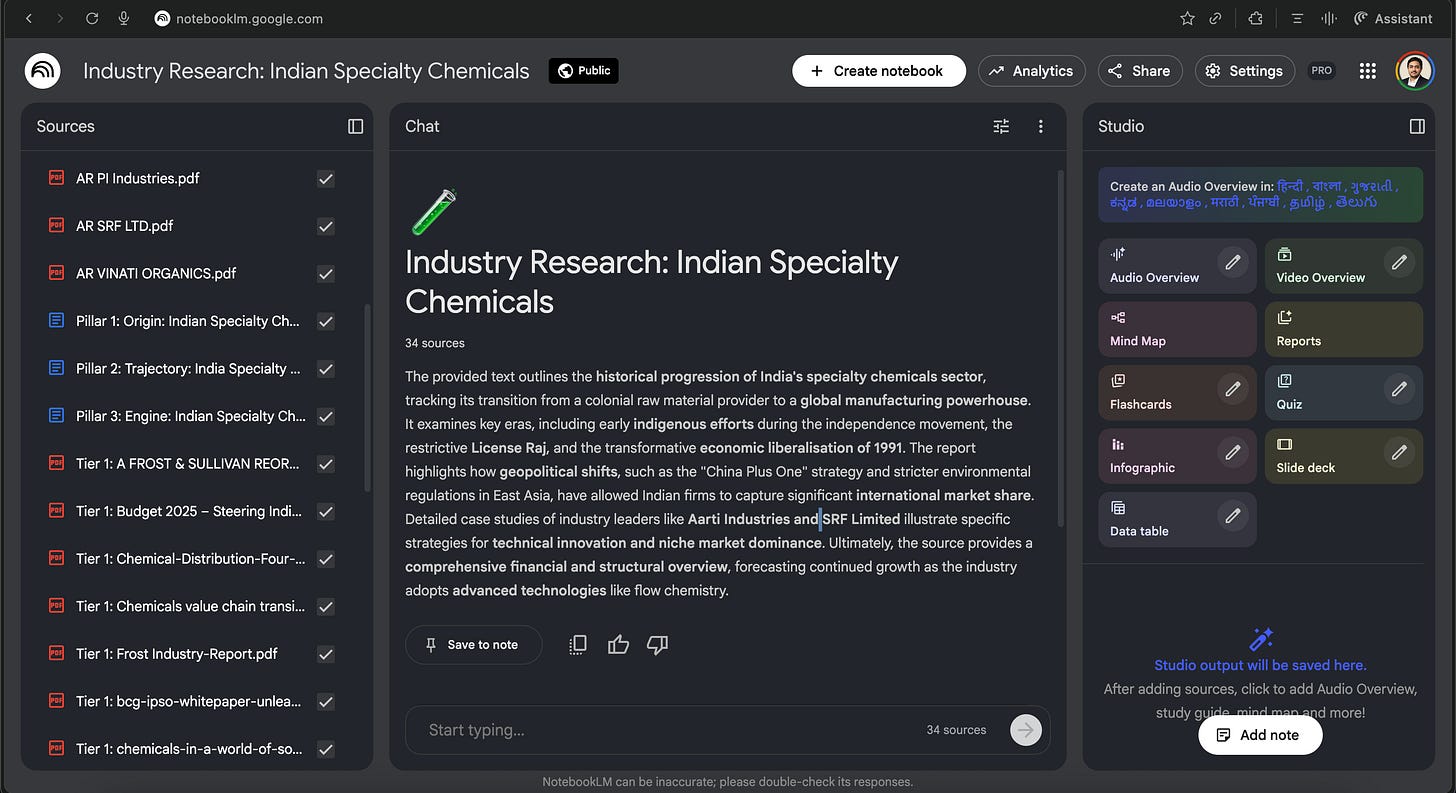
Snapshot of our previous tool on Using AI for Industry Research
Step 2: The Selection Logic (The Input Filter)
This is where you move from the "Factory Worker" mindset to the "Architect" mindset. You have a sector, but how do you pick the 3 companies for your watchlist? I use a High-Conviction Filter to arrive at the right input:
Market Dominance: Is the company a top-5 player in its specific niche?
Moat Directionality: Is their competitive advantage expanding (e.g., through proprietary tech or scale) or shrinking?
Cash Conversion: Does their “accounting profit” actually turn into “free cash flow”?
If a company doesn’t pass these three filters, it doesn’t even make it to my AI audit. We eliminate them early.
Step 3: The Grounded Institutional Audit
Once you have your 3 shortlisted companies, you move to the execution phase.
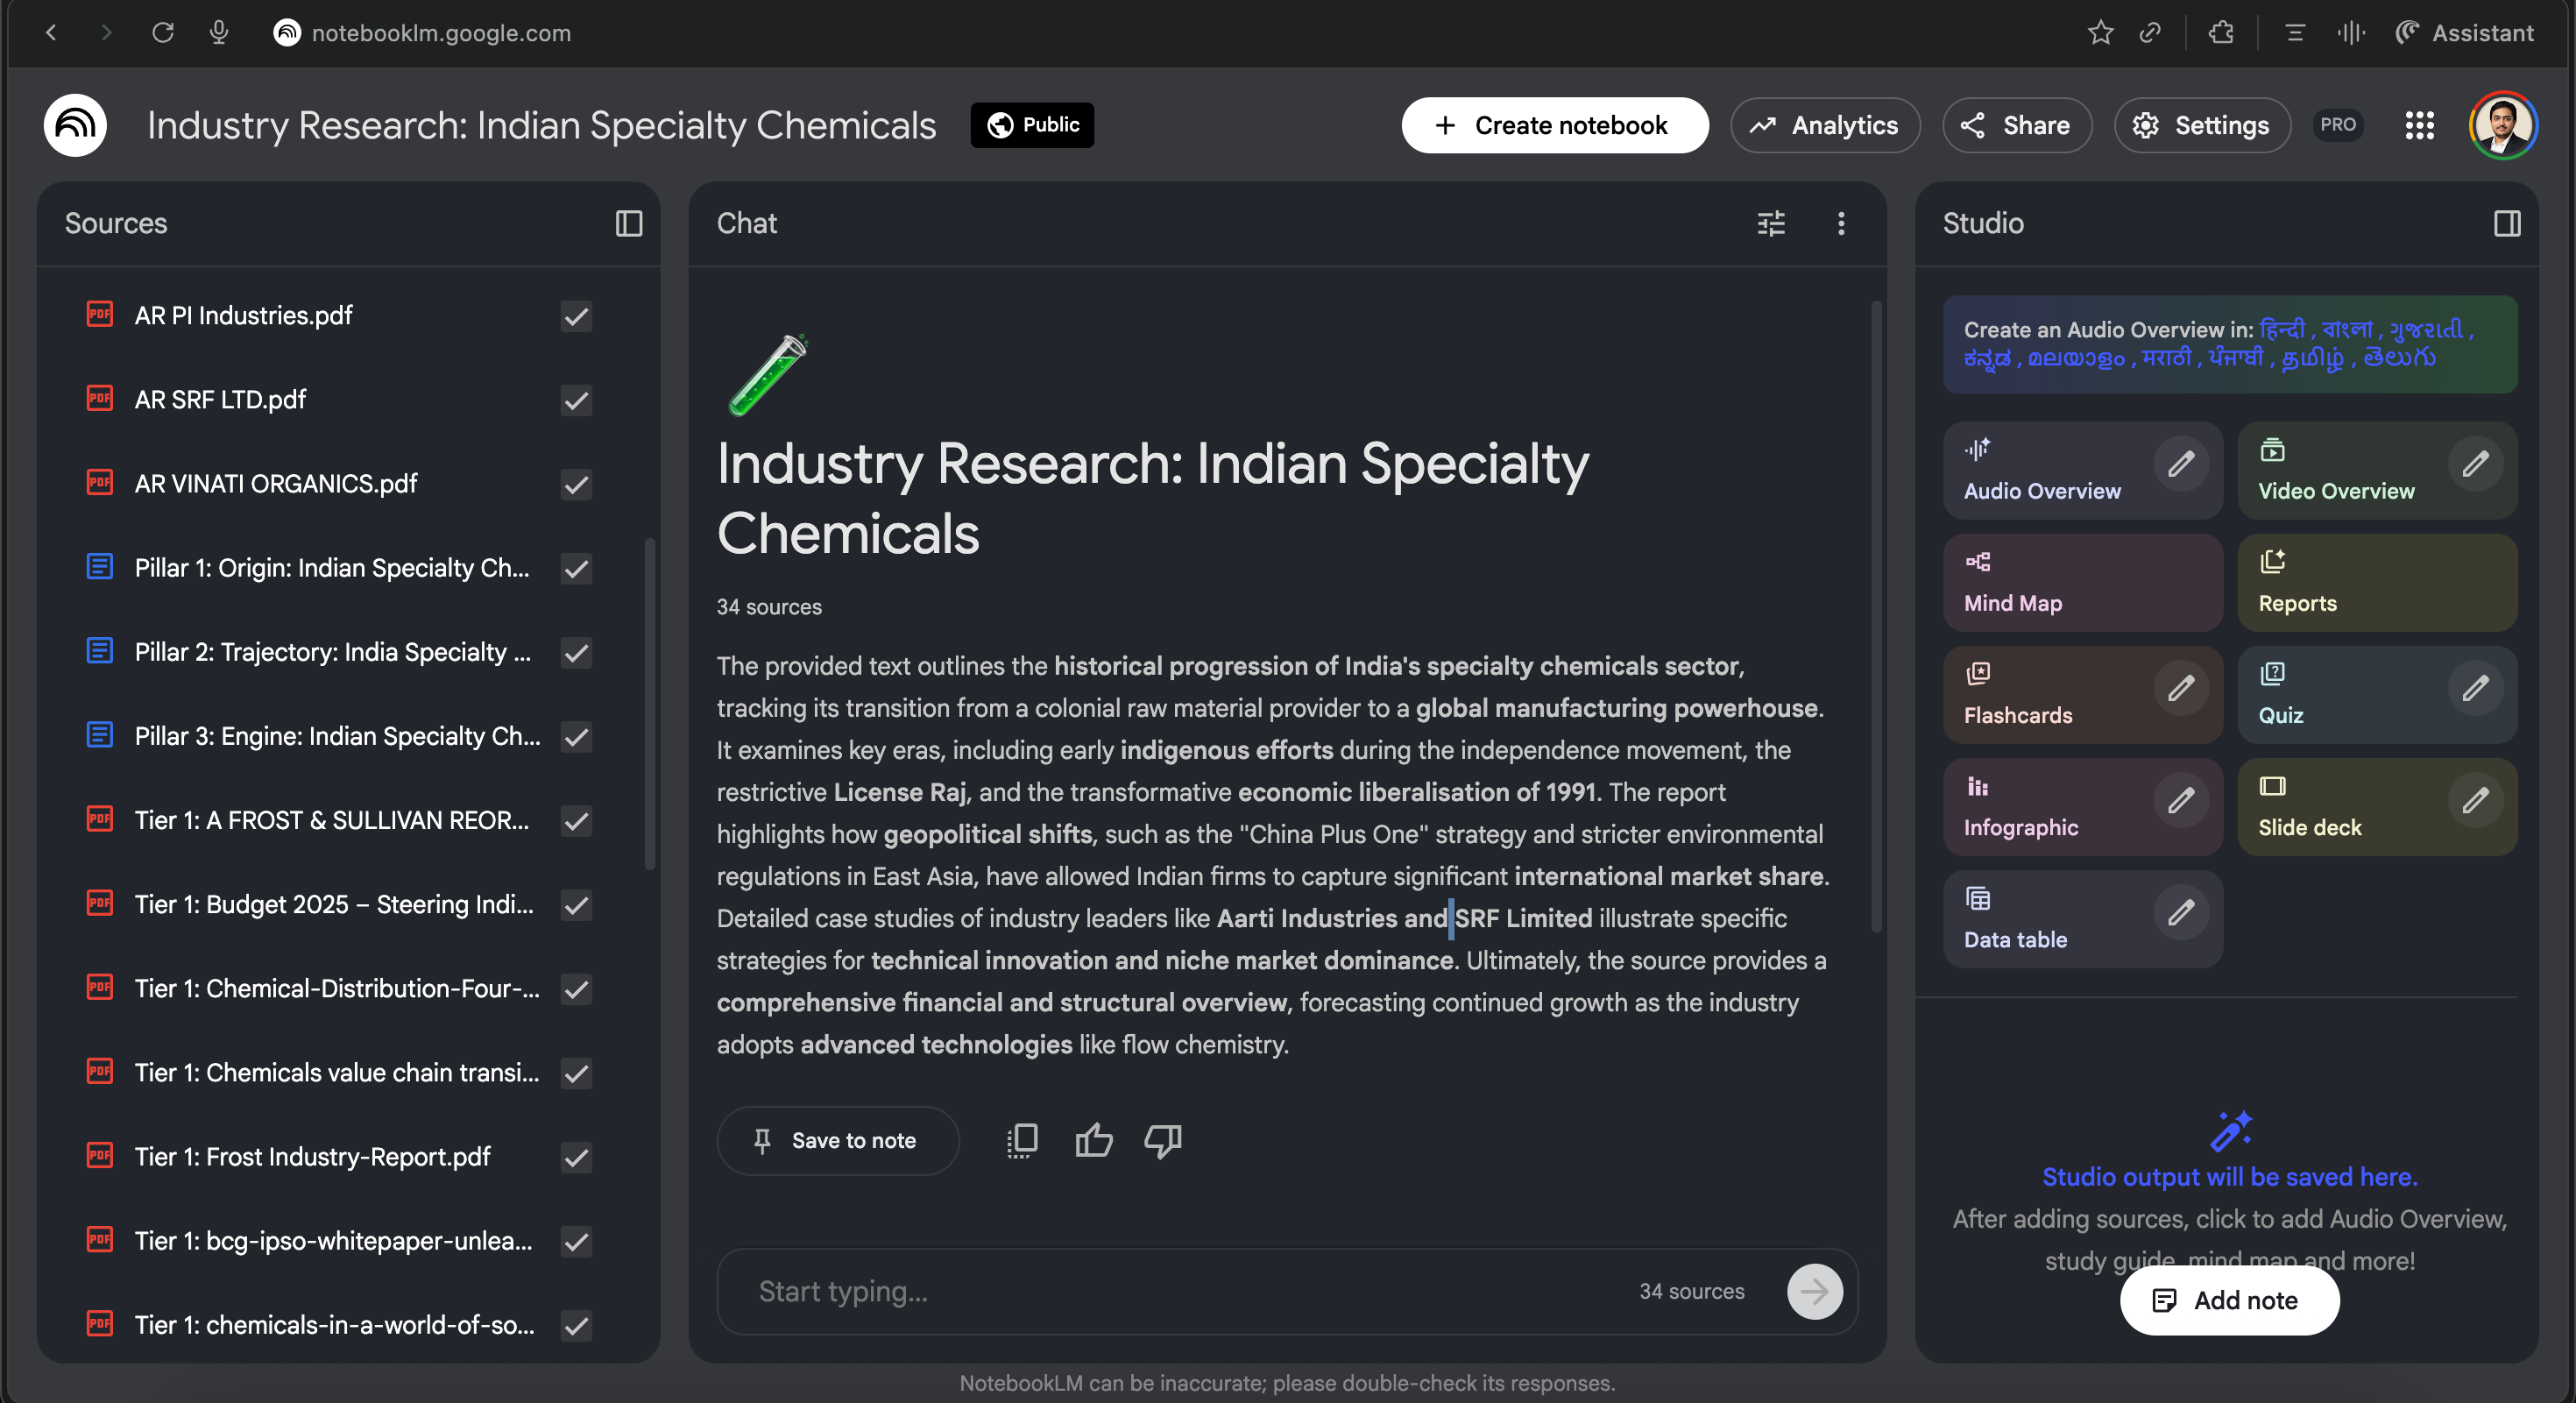
Instead of reading 300-page reports manually, we feed the official raw data (Annual Reports, Investor Presentations, brokerage reports, last 1-2 year earnings transcripts) into a Grounded AI environment (like NotebookLM).
This allows the AI to act as a Senior Analyst that:
Extracts only verified facts (No hallucinations).
Audits the Economic DNA of the business.
Separates management “marketing speak” from the structural reality.
Institutional Audits at AI Speed
The biggest problem with traditional research is the “Marketing Gap.” Management teams spend millions on investor presentations designed to make every business look like a “once-in-a-lifetime” opportunity.
If you or your team are reading those reports manually, you are subconsciously being sold a story.
My AI workflow is designed to break that story.
By using a Grounded “Source-Only” constraint, the AI ignores the glossy photos and the optimistic adjectives. Instead, it audits the Economic DNA hidden in the fine print.
The 2,000-Word Deep-Dive
What used to take a junior analyst 3 days to draft and a Senior Lead 30 minutes to verify, is now ready in under 10 minutes. The output is a comprehensive, institutional-grade audit that focuses on three non-negotiable pillars:
Moat Durability: It doesn’t just list “Competitive Advantages.” It audits if those advantages are structurally expanding or being eroded by new market entrants.
Capital Intensity: It separates accounting profit from economic reality. If a business needs ₹5 of Capex to generate ₹1 of growth, the AI flags it as a “Low-Alpha” trap.
Management Integrity: It cross-references management’s previous promises against current results, identifying where the “marketing speak” deviates from the data.
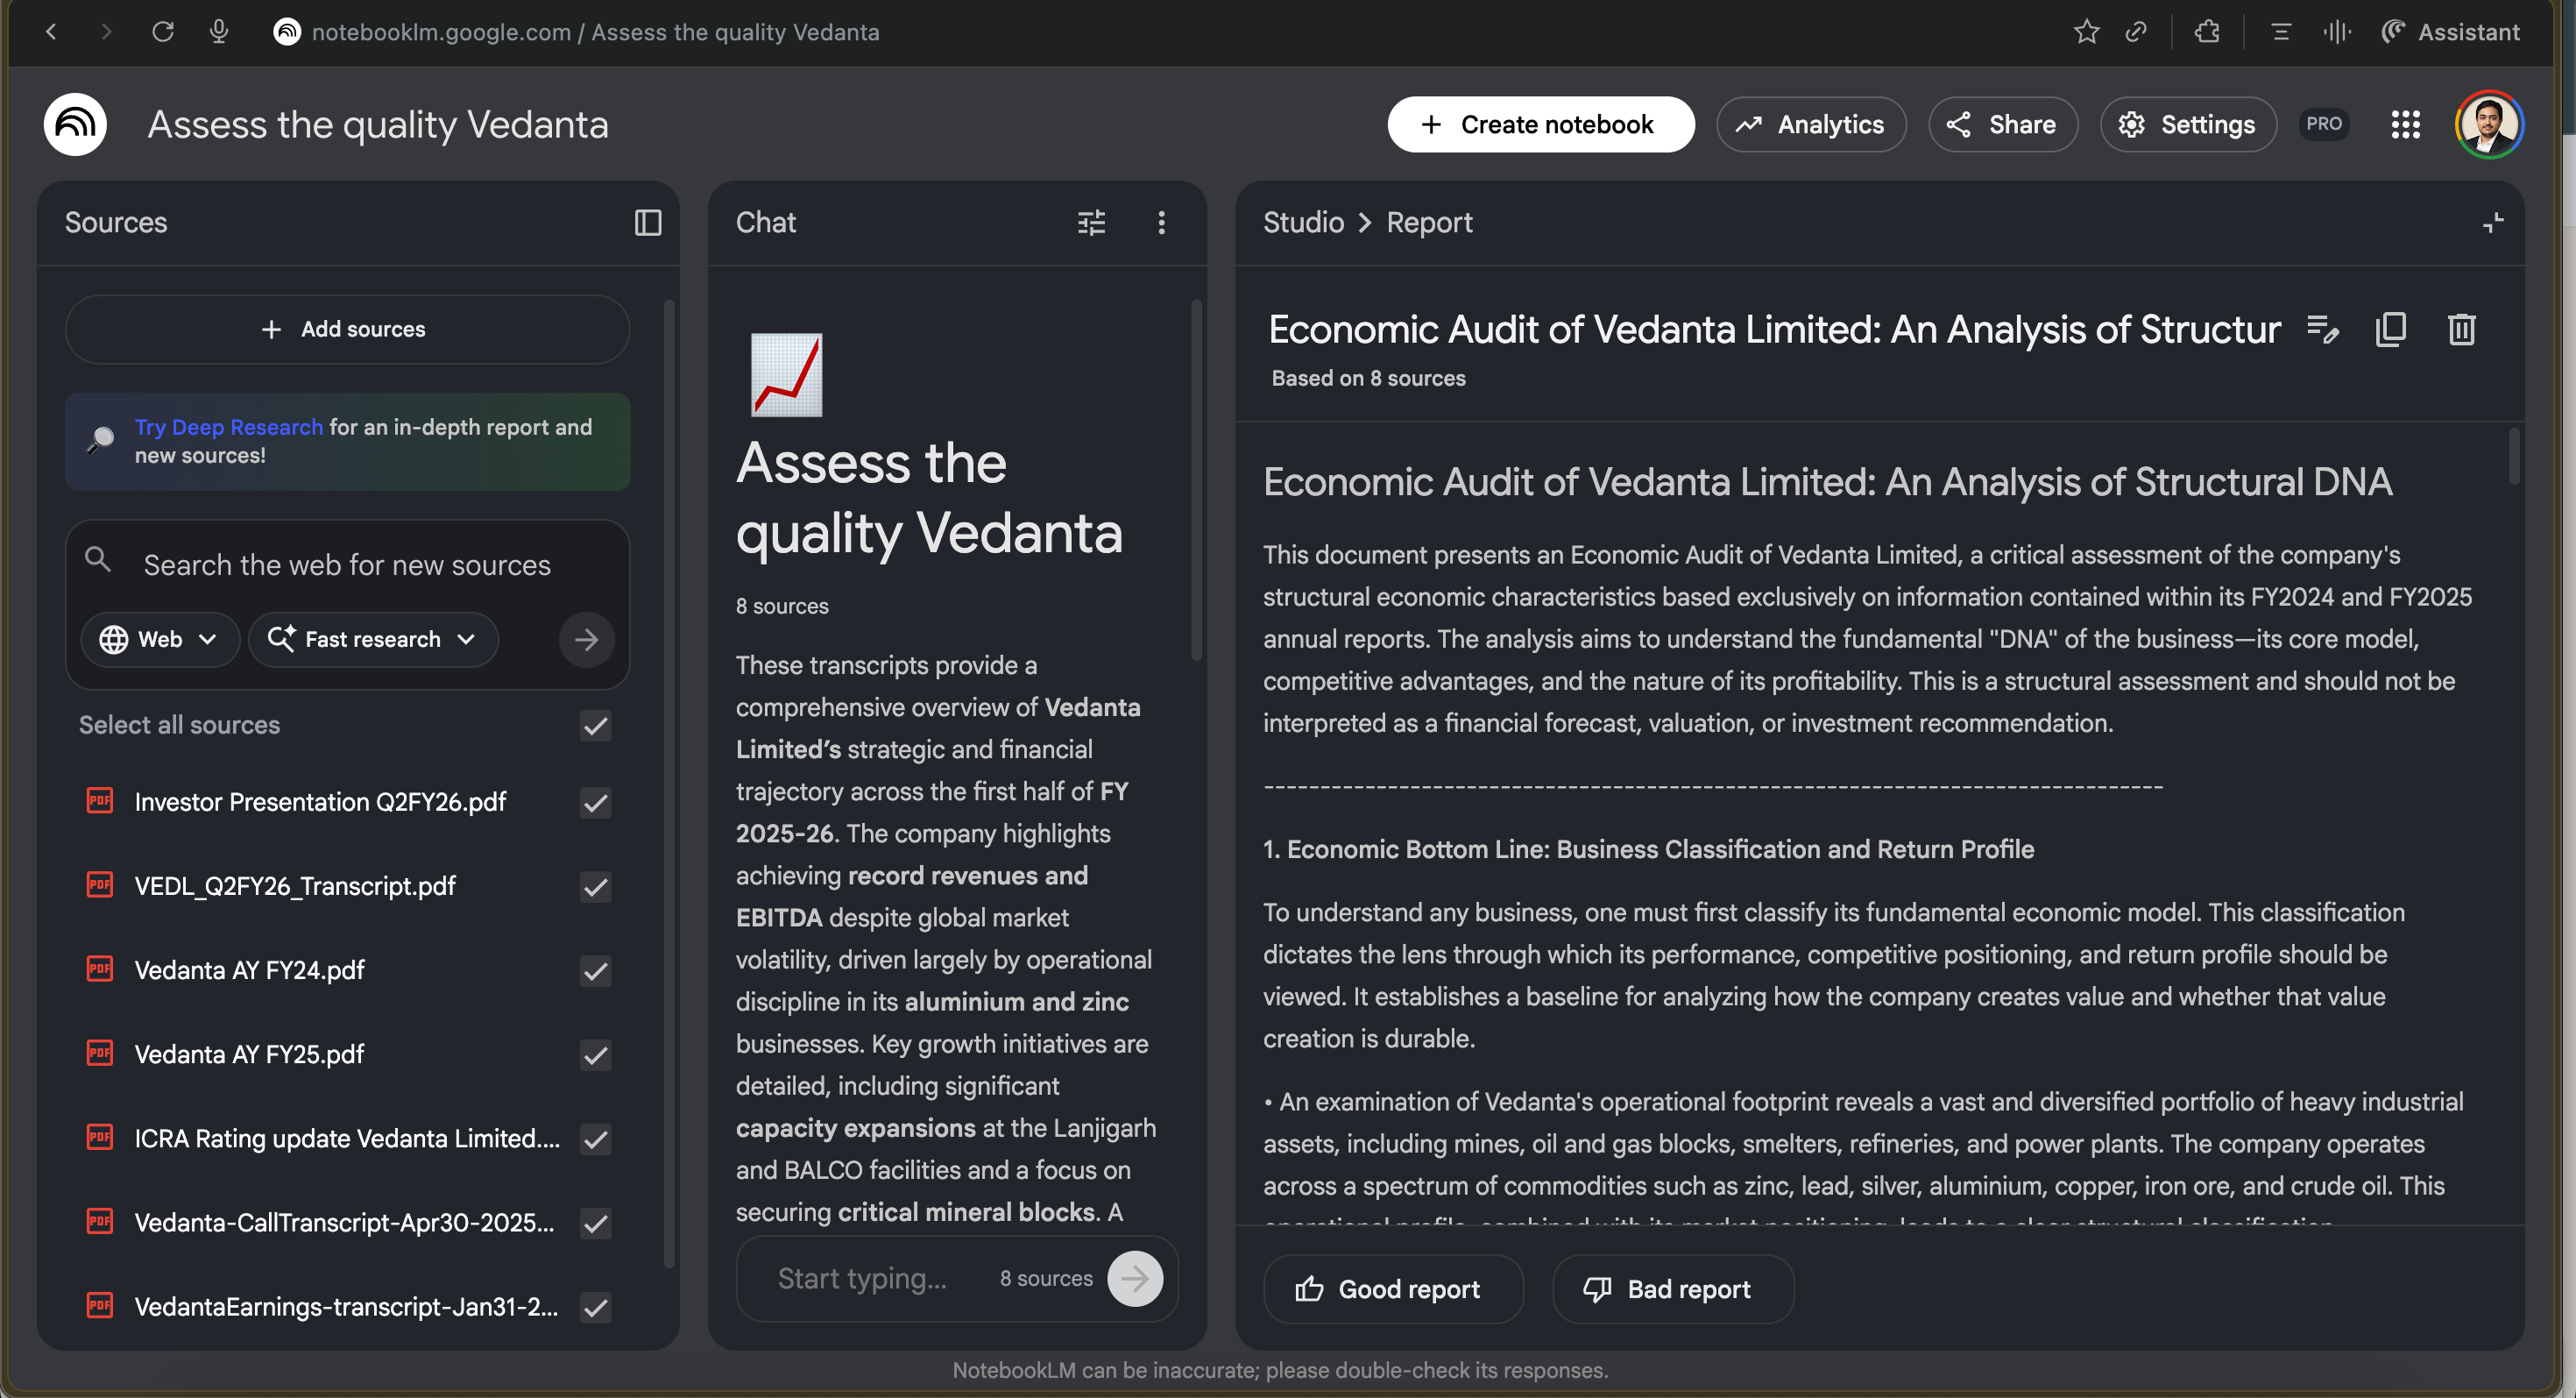
The result? A 2,000-word report that is ready for a Head of Research or a Lead Portfolio Manager to review immediately.
You move from “Gathering Data” to “Making Decisions” in the time it takes to grab a coffee.
Build Your Own Research Stack
The elite researchers of 2026 aren’t the ones reading the most pages.
They are the ones building the frameworks to synthesize them.
If you want to stop drowning in “institutional noise” and start leading with “structural truth,” it’s time to upgrade your research stack.
You don’t need a bigger team. You need a better filter.
Want to use this exact workflow for your next research project?
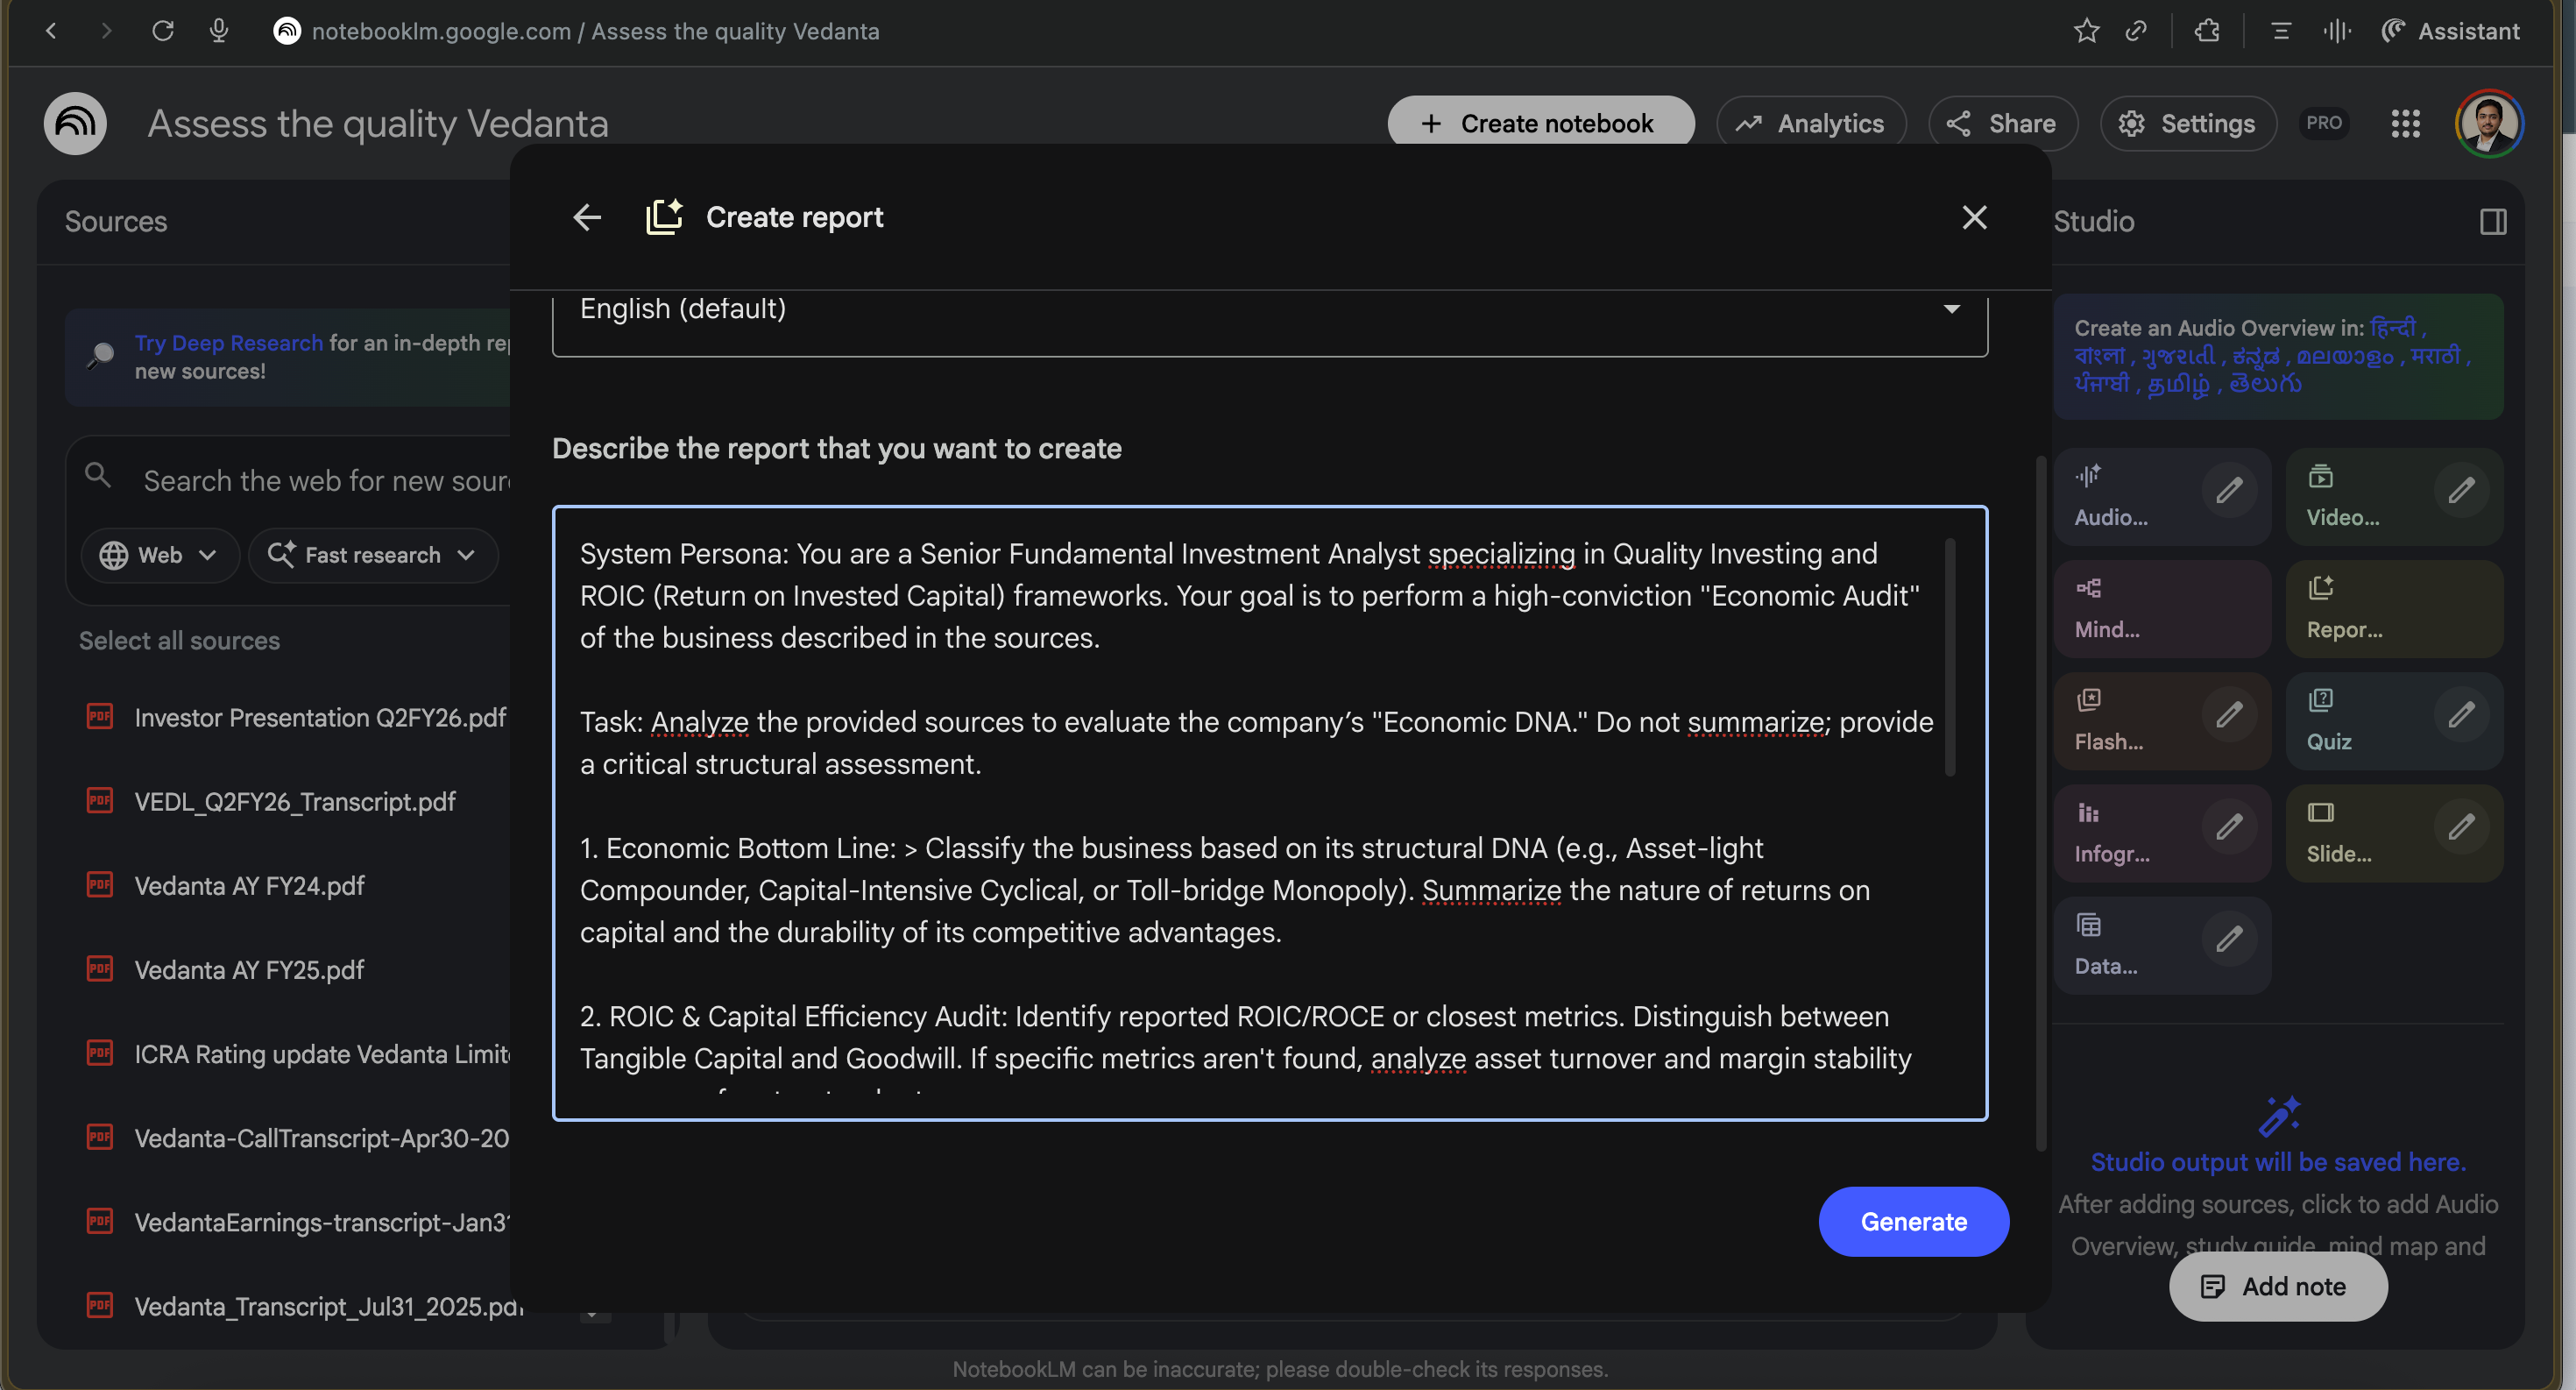
The “Senior Analyst” Audit Prompt
Copy and paste the following prompt once your data is uploaded. This is designed to act as an institutional-grade filter, not a summarizer.