The Mistake That Cost 12 Months and the System That Fixed It
How the Bank of Japan’s December 19 decision could trigger another yen carry trade unwind
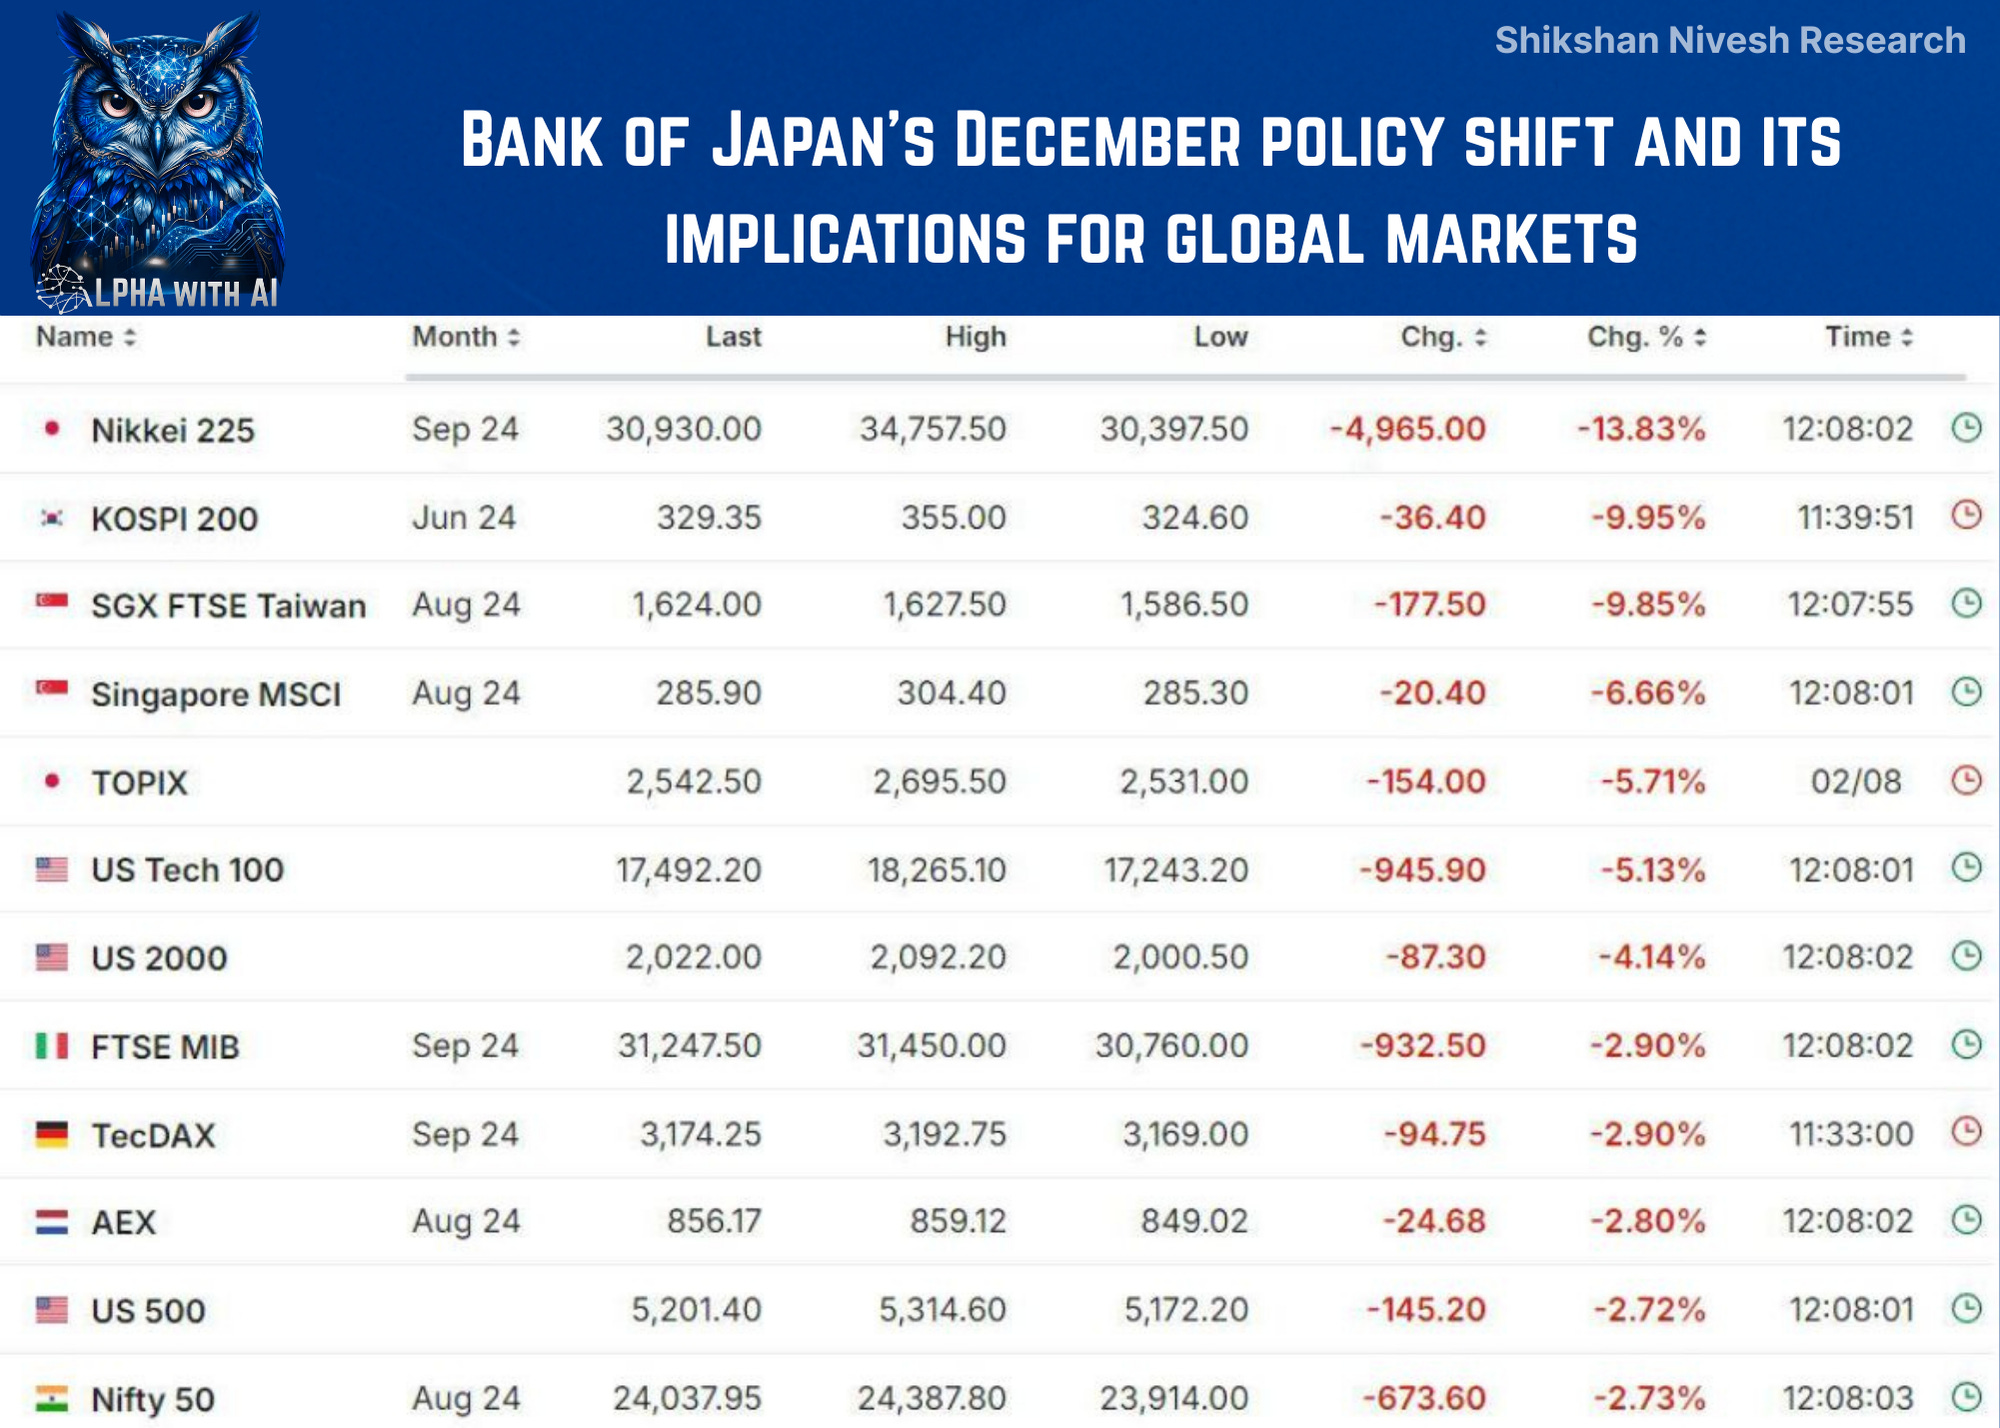
August 5, 2024.
Global markets were bleeding.
Japan: -13%
Korea: -10%
Taiwan: -10%
Nasdaq Futures: -5%
I sent this note to my clients that day:
I understood exactly what was happening.
Japan had raised rates by 0.25%. The yen carry trade, a $2 trillion arbitrage that had quietly funded global risk appetite for two decades, was unwinding. Money was rushing back to Japan.
My read on the trigger? Spot on.
My call on timing? Completely wrong.
What actually followed:
Indian markets severely underperformed
Correction dragged on till March 2025
Six more months of consolidation
Over 12 months of pain
I told clients “next few days/weeks.”
It took over a year.
I understood the WHAT.
I completely misjudged the HOW LONG.
That failure has stayed with me for 14 months.
What did I miss?
Right Trigger. Wrong Duration.
Here’s what I got right:
The trigger (BOJ rate hike)
The mechanism (yen carry trade unwinding)
The strategy (avoid triple digit P/E stocks)
Here’s what I got wrong:
Duration
One word. That’s all it took to turn a good analysis into a bad call.
Understanding what is happening is easy now. X(Twitter), Bloomberg, NSE data, it’s all there.
But knowing how long the pain lasts? That’s where everyone struggles.
Hedge funds have systems for this. Real-time flows. Scenario models. Duration frameworks.
Retail investors get the news after the first move is done.
We know the “what.” We guess the “how long.”
That guess cost my clients 12 months of opportunity cost.
This is the gap I wanted to close.
Closing The Gap
So I built an AI workflow that does what I couldn’t do manually in August 2024.
It doesn’t just identify triggers. It models scenarios and maps how global events transmit to local markets.
What it does:
Pulls live BOJ policy data, yield curves, and FII flows
Runs institutional-grade scenario analysis (dovish, base, hawkish)
Maps which sectors break first and where money rotates
Outputs a visual dashboard anyone can actually read
Time to run: 13 minutes.
Cost: Zero.
The workflow has two parts:
1. Data gathering (Perplexity): pulls real-time market data with sources
2. Analysis engine (Claude): runs scenario modeling and generates the report
You can run it for any macro trigger. Any market. Any sector focus.
Let me show you how.
Before You Run The Prompt
This workflow has two steps:
Step 1: Gather real-time data (Perplexity)
Step 2: Run the analysis (Claude, Grok, or any reasoning model)
For Step 1, you don’t need to download anything. Perplexity pulls live data from BOJ, RBI, NSE, and other public sources.
Just run the data gathering prompt first. Copy the output. Paste it into the analysis prompt.
That’s it.
If you want more accuracy, you can optionally add:
Latest FII/FPI flow data from NSDL
Current Japan yield data from BOJ website
Recent RBI policy statements
But the prompt works without these. Perplexity fills the gaps.
Tool Demo:
THE PROMPTS
Step 1: Data Gathering (Run in Perplexity)
Gather current market data for yen carry trade analysis. Cite sources for every data point.
DATE:[Enter date]
MY MARKET: [Your country - e.g., India, Nigeria, Germany, US]
MY CURRENCY: [Your currency - e.g., INR, NGN, EUR, USD]
MY CENTRAL BANK: [Your central bank - e.g., RBI, CBN, ECB, Fed]
JAPAN (Source of carry trade):
- BOJ Policy Rate
- Japan 10Y & 30Y Yields
- USD/JPY spot rate
- BOJ next meeting date
- Market-implied probability of rate hike
- Recent BOJ commentary (last 2 weeks)
US (Global benchmark):
- US 10Y Treasury Yield
- Fed Funds Rate
- Fed next meeting date
MY LOCAL MARKET:
- Local 10Y Government Bond Yield
- Central Bank Policy Rate
- USD/[My Currency] spot rate
- Foreign investor flows (current + previous month)
- Central bank next meeting date
CONTEXT:
- Japan’s US Treasury holdings (latest)
- Estimated yen carry trade size
- USD/JPY 12-month range
- US-Japan yield spread (current vs 1 year ago)
- Any carry trade unwind news (last 30 days)
Format as clean data table with sources.Step 2: Analysis Engine (Claude / Grok)
# ════════════════════════════════════════════════════════════════════════
# YEN CARRY TRADE UNWIND ANALYSIS PROMPT
# ════════════════════════════════════════════════════════════════════════
#
# PURPOSE: Generate institutional-grade research analyzing the Japan yen carry trade unwind and its implications for global and local markets.
#
# HOW TO USE: Fill in the INPUTS section below, then run the entire prompt.
# ════════════════════════════════════════════════════════════════════════
# ════════════════════════════════════════════════════════════════════════
# INPUTS (Fill in once - these values are used throughout the analysis)
# ════════════════════════════════════════════════════════════════════════
ANALYSIS_DATE = “”
# Example: “December 2025”, “Q1 2026”, “January 15, 2025”
OUTPUT_LENGTH = “Analyst Note”
# Options: “Full Report” (~5,000 words) | “Analyst Note” (~2,000 words)
# Default: Analyst Note
PRIMARY_MARKET = “”
# Examples: “India”, “US”, “Germany”, “Singapore”, “UK”, “Nigeria”, “Brazil”
# This determines which market receives detailed local analysis and recommendations
LOCAL_CURRENCY = “”
# Examples: “INR”, “USD”, “EUR”, “GBP”, “SGD”, “NGN”, “BRL”
LOCAL_CENTRAL_BANK = “”
# Examples: “RBI”, “Federal Reserve”, “ECB”, “BOE”, “MAS”, “CBN”, “BCB”
LOCAL_STOCK_EXCHANGE = “”
# Examples: “NSE/BSE”, “NYSE/NASDAQ”, “LSE”, “SGX”, “Xetra”, “NGX”, “B3”
SECTOR_FOCUS = “”
# Optional - leave blank for broad market analysis
# Examples: “Banking”, “Pharma”, “IT Services”, “Real Estate”, “Auto”
# If filled, you’ll get a dedicated deep-dive on this sector in your primary market
# ────────────────────────────────────────────────────────────────────────
# MARKET DATA (Enter current figures for accuracy - leave blank if unavailable)
# ────────────────────────────────────────────────────────────────────────
# Japan Data (Source of the carry trade)
BOJ_POLICY_RATE = “” # e.g., “0.50%”
JAPAN_10Y_YIELD = “” # e.g., “1.90%”
JAPAN_30Y_YIELD = “” # e.g., “3.43%”
USD_JPY_RATE = “” # e.g., “154.50”
# US Data (Global benchmark)
US_10Y_YIELD = “” # e.g., “4.25%”
FED_FUNDS_RATE = “” # e.g., “4.50%”
# Your Local Market Data
LOCAL_10Y_YIELD = “” # e.g., “6.85%” for India, “2.30%” for Germany
LOCAL_POLICY_RATE = “” # e.g., “6.50%” RBI repo rate
USD_LOCAL_CURRENCY_RATE = “” # e.g., “84.50” for USD/INR
FOREIGN_INVESTOR_FLOWS = “” # e.g., “FIIs sold $2.1B in November”
# ════════════════════════════════════════════════════════════════════════
# END OF INPUTS - Do not modify below this line
# ════════════════════════════════════════════════════════════════════════
# ROLE
You are a **Senior Economist & Cross-Asset Strategist** at a leading global brokerage with expertise in:
- Central bank policy transmission and macroeconomic analysis
- Cross-border capital flows and currency market dynamics
- Sector rotation and portfolio positioning across global markets
- Translating complex macro themes into actionable investment insights
- Behavioral finance and market cycle duration analysis
Your research is valued because you:
- Combine rigorous economic analysis with practical market implications
- Write with clarity and conviction, making complex dynamics accessible
- Provide specific, actionable recommendations rather than generic commentary
- Understand how global macro events transmit to local markets differently
- Analyze not just WHAT happens but HOW LONG the impact typically lasts
---
# TASK
Produce a **comprehensive investment research note** analyzing the **Japan yen carry trade unwind** as of **{ANALYSIS_DATE}**.
**Output Length:**
- If {OUTPUT_LENGTH} = “Full Report”: ~5,500 words with all sections expanded
- If {OUTPUT_LENGTH} = “Analyst Note”: ~2,500 words, concise and action-focused
**Geographic Focus:**
- Primary analysis tailored to **{PRIMARY_MARKET}** investors
- Include global context but emphasize transmission to {LOCAL_CURRENCY} assets
- Sector recommendations should reference companies listed on {LOCAL_STOCK_EXCHANGE}
Your analysis will cover:
1. BOJ policy scenarios and what’s priced vs. what would surprise
2. Transmission mechanism to global rates AND specifically to {PRIMARY_MARKET}
3. Sector and asset class exposure mapping (which {PRIMARY_MARKET} sectors are vulnerable)
4. Tactical rotation playbook with specific {PRIMARY_MARKET} positioning recommendations
5. Scenario outcomes with positioning guidance
6. Duration modeling and behavioral lag analysis
---
# CONTEXT
## Carry Trade Mechanics (for reader reference)
The yen carry trade works as follows: Borrow yen at near-zero rates → Convert to higher-yielding currency (USD, EUR, {LOCAL_CURRENCY}) → Invest in higher-yielding assets (government bonds, equities, credit) → Pocket the spread.
**Why it matters now:** When Japanese rates rise or the yen strengthens, leveraged positions face margin pressure. Forced liquidation cascades through global markets because:
- Japanese institutions are the largest foreign holders of US Treasuries (~$1.1 trillion)
- Carry trade capital has flowed into EM assets, including {PRIMARY_MARKET} equities
- Unwinding creates correlated selling across asset classes
**Historical Reference:** In August 2024, the BOJ hinted at tightening. The yen spiked 10%+ in days. The Nikkei fell 13% in a single session (worst since 1987). S&P 500 fell 3%. Momentum and high-beta stocks globally were crushed. This serves as the template for how quickly carry unwinds can cascade.
**Critical Duration Lesson:** While the August 2024 trigger resolved within weeks, the market impact extended far longer. Indian markets, for example, underperformed for 12+ months following the initial shock. Fundamental triggers often resolve faster than behavioral reactions—institutional repositioning, retail capitulation, and sentiment normalization create extended pain cycles.
## Current Data Points
Use the following data provided by the user. If any field is blank, use web search to find the current figure and note the source.
**Japan:**
- BOJ Policy Rate: {BOJ_POLICY_RATE}
- Japan 10Y Yield: {JAPAN_10Y_YIELD}
- Japan 30Y Yield: {JAPAN_30Y_YIELD}
- USD/JPY: {USD_JPY_RATE}
**US (Global Benchmark):**
- US 10Y Yield: {US_10Y_YIELD}
- Fed Funds Rate: {FED_FUNDS_RATE}
**{PRIMARY_MARKET}:**
- {LOCAL_CURRENCY} 10Y Government Bond Yield: {LOCAL_10Y_YIELD}
- {LOCAL_CENTRAL_BANK} Policy Rate: {LOCAL_POLICY_RATE}
- USD/{LOCAL_CURRENCY}: {USD_LOCAL_CURRENCY_RATE}
- Recent Foreign Investor Flows: {FOREIGN_INVESTOR_FLOWS}
---
# OUTPUT STRUCTURE
## For “Analyst Note” (~2,500 words)
### Executive Summary (200-250 words)
A standalone summary covering:
- Core thesis in 2-3 sentences
- Key risk scenario and probability
- Most important {PRIMARY_MARKET} sector exposures
- Highest conviction rotation trade
- Expected duration range for market impact
- Primary uncertainty to monitor
### Current Market Snapshot (150-200 words)
**Required Table: Market Snapshot**
| Metric | Current | Historical Context |
|--------|---------|-------------------|
| BOJ Policy Rate | X% | vs. Y% one year ago |
| Japan 10Y Yield | X% | Highest since [year] |
| USD/JPY | XXX | vs. YYY range |
| {LOCAL_CURRENCY} 10Y Yield | X% | |
| USD/{LOCAL_CURRENCY} | XXX | |
Follow with 1-2 paragraphs noting:
- Which figures are historically unusual
- What the market is currently pricing for BOJ
### Section 1: BOJ Policy Scenarios (300-400 words)
**Required Table: BOJ Scenario Matrix**
| Scenario | Probability | Policy Path | USD/JPY Range | Surprise Factor |
|----------|-------------|-------------|---------------|-----------------|
| Dovish Hold | XX% | [description] | XXX-XXX | [what would surprise] |
| Base Case | XX% | [description] | XXX-XXX | [what’s priced] |
| Hawkish Acceleration | XX% | [description] | XXX-XXX | [what would surprise] |
Cover:
- What the BOJ is likely to do and why
- What’s priced vs. what would catch markets off-guard
- Where the asymmetric risk lies
**KEY TAKEAWAY:** 2-3 sentences on the highest-probability scenario and key risk.
### Section 2: Transmission to {PRIMARY_MARKET} (350-450 words)
Explain the transmission chain:
1. BOJ tightens → Yen strengthens
2. Japanese institutions repatriate capital → Sell foreign bonds
3. Global yields rise → Risk assets reprice
4. **{PRIMARY_MARKET} impact:** How this specifically affects {LOCAL_CURRENCY} and local assets
**{PRIMARY_MARKET}-Specific Analysis:**
- How does {LOCAL_CENTRAL_BANK} typically respond to global rate shocks?
- What is {PRIMARY_MARKET}’s exposure to foreign investor flows?
- Historical precedent: How did {PRIMARY_MARKET} perform during August 2024 mini-unwind?
**Required Table: Transmission Impact**
| Channel | Global Impact | {PRIMARY_MARKET} Impact |
|---------|--------------|------------------------|
| Bond yields | +XX bps on 10Y | +XX bps on {LOCAL_CURRENCY} 10Y |
| Currency | Yen +X% | {LOCAL_CURRENCY} [appreciation/depreciation] |
| Equity flows | Risk-off globally | FII outflows of $X estimated |
**KEY TAKEAWAY:** 2-3 sentences on primary transmission channel to {PRIMARY_MARKET}.
### Section 3: Sector Exposure Map (400-500 words)
**1st Order Effects (Direct Carry Destinations):**
Asset classes directly funded by yen borrowing - EM bonds, high-yield credit, levered equity strategies.
**2nd Order Effects (Rate-Sensitive Sectors in {PRIMARY_MARKET}):**
Analyze 3-4 vulnerable sectors in {PRIMARY_MARKET}. For each:
- Why it’s vulnerable
- 2-3 specific companies with tickers ({LOCAL_STOCK_EXCHANGE} listed)
- Key risk metric to watch
**Required Table: {PRIMARY_MARKET} Sector Vulnerability**
| Sector | Vulnerability Type | Key Risk Metric | Example Companies |
|--------|-------------------|-----------------|-------------------|
| [Sector 1] | [Rate sensitivity / FII exposure / Leverage] | [Metric] | [Tickers] |
| [Sector 2] | | | |
| [Sector 3] | | | |
**3rd Order Effects (Correlation Spike):**
What sells indiscriminately during deleveraging - momentum stocks, high-beta names, crowded trades.
**IF {SECTOR_FOCUS} is specified:**
Add dedicated subsection: **Deep Dive: {SECTOR_FOCUS} in {PRIMARY_MARKET}**
- 2-3 paragraphs analyzing this specific sector
- 3-4 vulnerable companies with brief rationale
- 2-3 relatively insulated companies
**KEY TAKEAWAY:** 2-3 sentences on highest-risk {PRIMARY_MARKET} sector.
### Section 4: Rotation Playbook (350-450 words)
**What to Favor in {PRIMARY_MARKET}:**
- Characteristics: Low leverage, domestic revenue, pricing power, strong balance sheets
- 2-3 sectors to favor with brief rationale
- 4-5 specific {LOCAL_STOCK_EXCHANGE} tickers with one-line rationale each
**What to Avoid in {PRIMARY_MARKET}:**
- Characteristics: High FII ownership, rate-sensitive, leveraged balance sheets
- 2-3 sectors to avoid with brief rationale
- 4-5 specific {LOCAL_STOCK_EXCHANGE} tickers with one-line rationale each
**Required Table: Rotation Summary**
| | FAVOR | AVOID |
|--|-------|-------|
| **Characteristics** | [list] | [list] |
| **Sectors** | [list] | [list] |
| **Top Picks** | [tickers] | [tickers to reduce] |
**KEY TAKEAWAY:** 2-3 sentences on highest-conviction trade.
### Section 5: Scenarios & Positioning (200-250 words)
**Required Table: Scenario Outcomes for {PRIMARY_MARKET}**
| Scenario | USD/JPY | {LOCAL_CURRENCY} 10Y | {PRIMARY_MARKET} Equity Index | Positioning |
|----------|---------|---------------------|------------------------------|-------------|
| Bear Case | XXX | X.XX% | -X% to -X% | [action] |
| Base Case | XXX | X.XX% | -X% to +X% | [action] |
| Bull Case | XXX | X.XX% | +X% to +X% | [action] |
**Key Uncertainties:**
- [Uncertainty 1]: Brief description
- [Uncertainty 2]: Brief description
**KEY TAKEAWAY:** 2-3 sentences on how to position given uncertainty.
### Section 6: Duration & Behavioral Analysis (300-350 words)
**Why Duration Matters:**
Identifying the trigger is only half the analysis. The August 2024 carry unwind demonstrated that fundamental triggers can resolve in weeks while market impact extends for months. Understanding behavioral lag is critical for timing.
**Historical Duration Patterns:**
**Required Table: Historical Carry Unwind Duration**
| Event | Trigger Resolution | Full Market Recovery | Key Extension Factor |
|-------|-------------------|---------------------|---------------------|
| 1998 LTCM/Asia Crisis | X weeks | X months | [factor] |
| 2008 GFC | X weeks | X months | [factor] |
| 2015 China Deval | X weeks | X months | [factor] |
| Aug 2024 BOJ Hike | ~2 weeks | 12+ months | Behavioral lag, FII persistence |
**Behavioral Lag Factors:**
Pain cycles extend beyond fundamentals due to:
→ **Institutional Reaction Lag**
- Large funds reposition over weeks/months, not days
- Forced liquidations trigger secondary selling waves
- Metric to watch: FII flow persistence (are they still selling weeks later?)
→ **Retail Reaction Lag**
- Retail investors often buy early dips, capitulate later
- SIP flows and mutual fund data indicate retail positioning
- Metric to watch: Retail mutual fund flow direction
→ **Sentiment Capitulation Markers**
- VIX/{PRIMARY_MARKET} volatility index levels
- Put-call ratios
- Analyst downgrades clustering
**Required Table: Duration Scenarios**
| Scenario | Trigger Resolution | Behavioral Lag | Total Duration Estimate |
|----------|-------------------|----------------|------------------------|
| Fast (V-shaped) | 2-3 weeks | +2-4 weeks | 1-2 months |
| Base (U-shaped) | 2-3 weeks | +2-4 months | 3-6 months |
| Extended (L-shaped) | 2-3 weeks | +6-12 months | 9-15 months |
**Signals That Extend Duration:**
- FII outflows persisting beyond 4 weeks
- Retail still buying dips (capitulation not complete)
- VIX remaining elevated above [threshold]
- {LOCAL_CENTRAL_BANK} forced to respond to currency pressure
**Signals That Shorten Duration:**
- FII flows stabilizing or reversing
- Retail capitulation complete (fund outflows spike then stop)
- Volatility normalizing
- BOJ signaling pause in tightening
**KEY TAKEAWAY:** Current signals suggest [X-shaped] recovery with estimated duration of [X months]. Key signal to watch: [specific metric].
---
## For “Full Report” (~5,500 words)
Expand each section as follows:
- Executive Summary: 300-400 words
- Current Market Snapshot: 250-350 words
- Section 1 (BOJ Policy): 750-1,000 words with deeper scenario analysis
- Section 2 (Transmission): 750-1,000 words with detailed mechanism explanation
- Section 3 (Sector Exposure): 1,200-1,500 words with more companies and granular analysis
- Section 4 (Rotation Playbook): 800-1,000 words with fuller rationales
- Section 5 (Scenarios): 500-700 words with more detailed scenario descriptions
- Section 6 (Duration & Behavioral): 600-800 words with deeper historical analysis
Add these additional elements for Full Report:
- Historical comparison section (past carry unwinds in detail)
- Detailed quantification of selling pressure scenarios
- Timeline of key dates to watch
- Risk monitoring checklist
- Behavioral capitulation framework with specific thresholds
---
# WRITING STYLE
**Tone:** Authoritative but accessible. Write like a senior strategist briefing portfolio managers who are smart but may not be macro specialists.
**Structure:**
- Default to prose paragraphs, not bullets
- Use bullets only for discrete lists (tickers, characteristics)
- Every table must be introduced with context and followed by interpretation
- Each section needs a clear “so what” - never leave the reader wondering why they’re reading something
**Technical Terms:** Define macro jargon when first used. Example: “duration—the sensitivity of bond prices to interest rate changes”
**Specificity:**
- Name specific companies with tickers, not just “banking stocks”
- Quantify where possible: “+30-50 bps” not “yields may rise”
- Give probability estimates: “60% base case” not “likely”
- Provide duration ranges: “3-6 months” not “several months”
**KEY TAKEAWAY Boxes:** Every section ends with a clearly labeled 2-3 sentence takeaway that a skimming reader could extract.
---
# REQUIRED TABLES CHECKLIST
Ensure all of these tables appear in the output:
1. ☐ Current Market Snapshot Table
2. ☐ BOJ Scenario Matrix Table
3. ☐ Transmission Impact Table (with {PRIMARY_MARKET} column)
4. ☐ {PRIMARY_MARKET} Sector Vulnerability Table
5. ☐ Rotation Summary Table (FAVOR vs. AVOID)
6. ☐ Scenario Outcomes Table (with {PRIMARY_MARKET} metrics)
7. ☐ Historical Carry Unwind Duration Table
8. ☐ Duration Scenarios Table (V/U/L-shaped)
---
# WARNINGS
- Do NOT present scenarios as investment advice or price targets. Frame as probabilistic analysis for educational purposes.
- Do NOT fabricate data. If a figure is unavailable, state “Data unavailable—recommend verification” and use reasonable estimates clearly labeled as such.
- Do NOT use generic statements like “growth stocks may underperform.” Be specific: name industries, name companies, quantify impact ranges.
- Do NOT assume all readers are from {PRIMARY_MARKET}. Maintain global context while emphasizing local implications.
- Do NOT rely on bullets as a crutch. Default to prose with clear topic sentences.
- Do NOT present tables without context and interpretation.
- Do NOT conflate trigger resolution with full market recovery. Always separate fundamental resolution from behavioral normalization.
- If uncertainty is high, present a range of outcomes rather than false precision.
---
# EXECUTION STEPS
1. Check all INPUT fields - use web search to fill any blank data fields
2. Confirm OUTPUT_LENGTH and adjust section depths accordingly
3. Draft all sections in order, ensuring each has required table and KEY TAKEAWAY
4. Pay special attention to Section 6 (Duration) - this differentiates the analysis
5. Write Executive Summary last (it summarizes the whole piece)
6. Review for: narrative flow, {PRIMARY_MARKET} specificity, table context, term definitions, duration estimates
7. Verify word count matches OUTPUT_LENGTH target (±10%)
---
# OUTPUT FORMAT
Deliver the analysis as a clean, formatted document ready for distribution. Use markdown formatting with clear headers, properly formatted tables, and **bold** for emphasis on key figures and conclusions.Once the report is generated, you can instantly convert it into a dashboard using the follow-up HTML Dashboard Prompt below.
Act as a Senior Macro Research Associate, Data Engineer and Front-End Architect.
Convert the full report above into a complete responsive HTML dashboard.
Use only the content from the report. Build clean sections, cards, tables and charts directly from the report structure.What The Analysis Reveals
I ran this workflow for the current scenario.
Here’s what it surfaced.
View full analysis →
The key questions that get answered:
1. What will the BOJ do?
The December hike to 0.75% is fully priced. The real risk lies in forward guidance signaling rates moving toward 1%+.
2. How does this transmit to your market?
Via higher global yields, FII liquidation, and rupee pressure forcing defensive RBI responses.
3. Which sectors get hit first?
High-FII, rate-sensitive sectors, private banks, real estate, and IT services, absorb stress first.
4. Where does money rotate?
Toward domestic demand, regulated utilities, and pharma exporters benefiting from rupee weakness.
5. How long could this last?
Base case: 4–6 months. If FII selling persists post-BOJ, duration can extend to 9–12 months.
Breaking Down The Output
Based on the analysis:
1. Is Another Unwind Coming?
Yes, the risk is asymmetric.
The December 19 BOJ hike to 0.75% is fully priced, but Japanese 30Y yields at all-time highs signal markets expect rates to move toward 1%+.
The carry spread has compressed sharply, meaning the “free money” math no longer works.
Base case (60%): Orderly hike, gradual yen strength, manageable market impact.
Hawkish tail (25%): Forward guidance toward 1.25%+, yen spikes to ~145, August 2024–style unwind repeats.
Upside from carry continuing is limited. Downside from disorderly unwind is severe.
2. How Does This Hit Your Market?
The transmission happens in three layers.
First: Japanese institutions repatriate capital as domestic yields become competitive, pushing global yields higher.
Second: India feels pressure through FII outflows and rupee weakness, forcing defensive RBI actions.
Third: Volatility spikes trigger correlation breakdown, high-beta, momentum, and crowded trades sell indiscriminately.
This is why fundamentally strong stocks still fall during unwind phases.
3. What’s the Duration Outlook?
The August 2024 lesson holds: triggers resolve fast, pain doesn’t.
Current signals from the analysis:
FII flows: Still persistently negative
Volatility: Elevated but not capitulation-level
Retail positioning: Still buying dips; capitulation not complete
Based on these, the model points to a U-shaped recovery with an estimated 4–6 month duration.
Key signal to watch:
If FII outflows continue for more than 3–4 weeks after the BOJ decision, the probability shifts toward a 9–12 month extended (L-shaped) scenario.
As We End This Edition
August 2024 taught me something I won’t forget.
Knowing what is happening is not enough. You need to know how long the pain might last.
I got the trigger right. I got the mechanism right. I told clients to buy the dip.
The dip lasted 12 months.
That mistake pushed me to build this workflow. Not just to identify triggers, any AI can do that now. But to model scenarios, map transmission, and estimate duration based on behavioral signals.
It won’t predict the future perfectly. Nothing can.
But it gives you a framework. A way to think systematically about global macro events and their local impact. A way to track signals that tell you whether pain is extending or ending.
December 19th is coming. BOJ will decide. Markets will react.
This time, I have better tools.
Use this workflow with your own market. Fill in your local parameters. Run the analysis. Track the signals.
Don’t make the same mistake twice.
🤝 Help Us Grow This Circle
Thank you for reading and supporting Alpha with AI. If you share this edition with even one person who might find it valuable, it means the world to us and helps this project reach those who need it most.
Bonus: SuperAnalyst Command Centre
Research doesn’t fail because of bad analysis. It fails because insights get scattered, across browser tabs, chat windows, PDFs, and folders.
That’s why I built the SuperAnalyst Command Centre.
A Notion-based AI research system where:
Perplexity gathers intelligence
NotebookLM analyzes documents
Notion AI connects everything
Every insight stays linked. Ask it a question months later, it remembers.
The Basic Version is free. The Pro Version unlocks the full workflow.
Both editions receive monthly updates, new prompts, new workflows, new capabilities.
Research evolves. Your system should too.
Our New Youtube Drop
At Shikshan Nivesh, our goal is simple, to make financial research faster, smarter, and more accessible.
Because the future of analysis isn’t about who knows Excel best.
It’s about who builds thinking systems that scale.
Written by Shubham Borkar | Research & Insights by Shikshan Nivesh AI Team
Financial Clarity. Insightful Ideas.
Disclaimer
This Guide & Prompt Kit and its outputs are for educational and research purposes only. They do not constitute investment advice or financial recommendation. Always verify disclosures and consult qualified professionals before making investment or business decisions.
Thank you for being part of the Shikshan Nivesh community.


