


I run a twelve-tab trading floor from inside my note-taking app.
One thing before anything else, because it changes how you read the rest: the whole desk is open source, which means the code is public and free for anyone to download and change, and the link sits at the end of this piece, so you can take mine and start from it, or follow how every tab got built and make your own, and I am explaining the whole process here so that either route works for you.
Anyone who takes markets seriously ends up with the same setup, and it grows on you without you noticing it. You have Finviz, Koyfin or Screener.in for the screening, OpenInsider for the insider filings, Capitol Trades for what Congress is buying, WhaleWisdom for the 13F filings, Quartr for the earnings call transcripts, OptionCharts for the options data, FRED and Trading Economics for the macro, Portfolio Visualizer for the backtests, Stock Analysis or Tijori for a clean set of financials, and a forum like ValuePickr for the discussion, because you tried each of them at some point and each one did one part of the job well enough to keep. Five or six tabs, seven or eight on a heavy day, and most of them are on a subscription.
Now, paying for them is not the problem. Some of those tools are definitely good at the one thing they do, and I am not going to tell you to cancel anything. The problem is that none of these tools talk to each other, which means you are the one doing the talking. You take a margin number out of the screener, you go and check it against the filing, you put it into your notes, and then you go to a fourth window to set the alert, and you do that ten times a day, twenty times a day, and after a while it feels normal, because every tool in that stack is automated and the only part that is not automated is the bit in between, which is you.
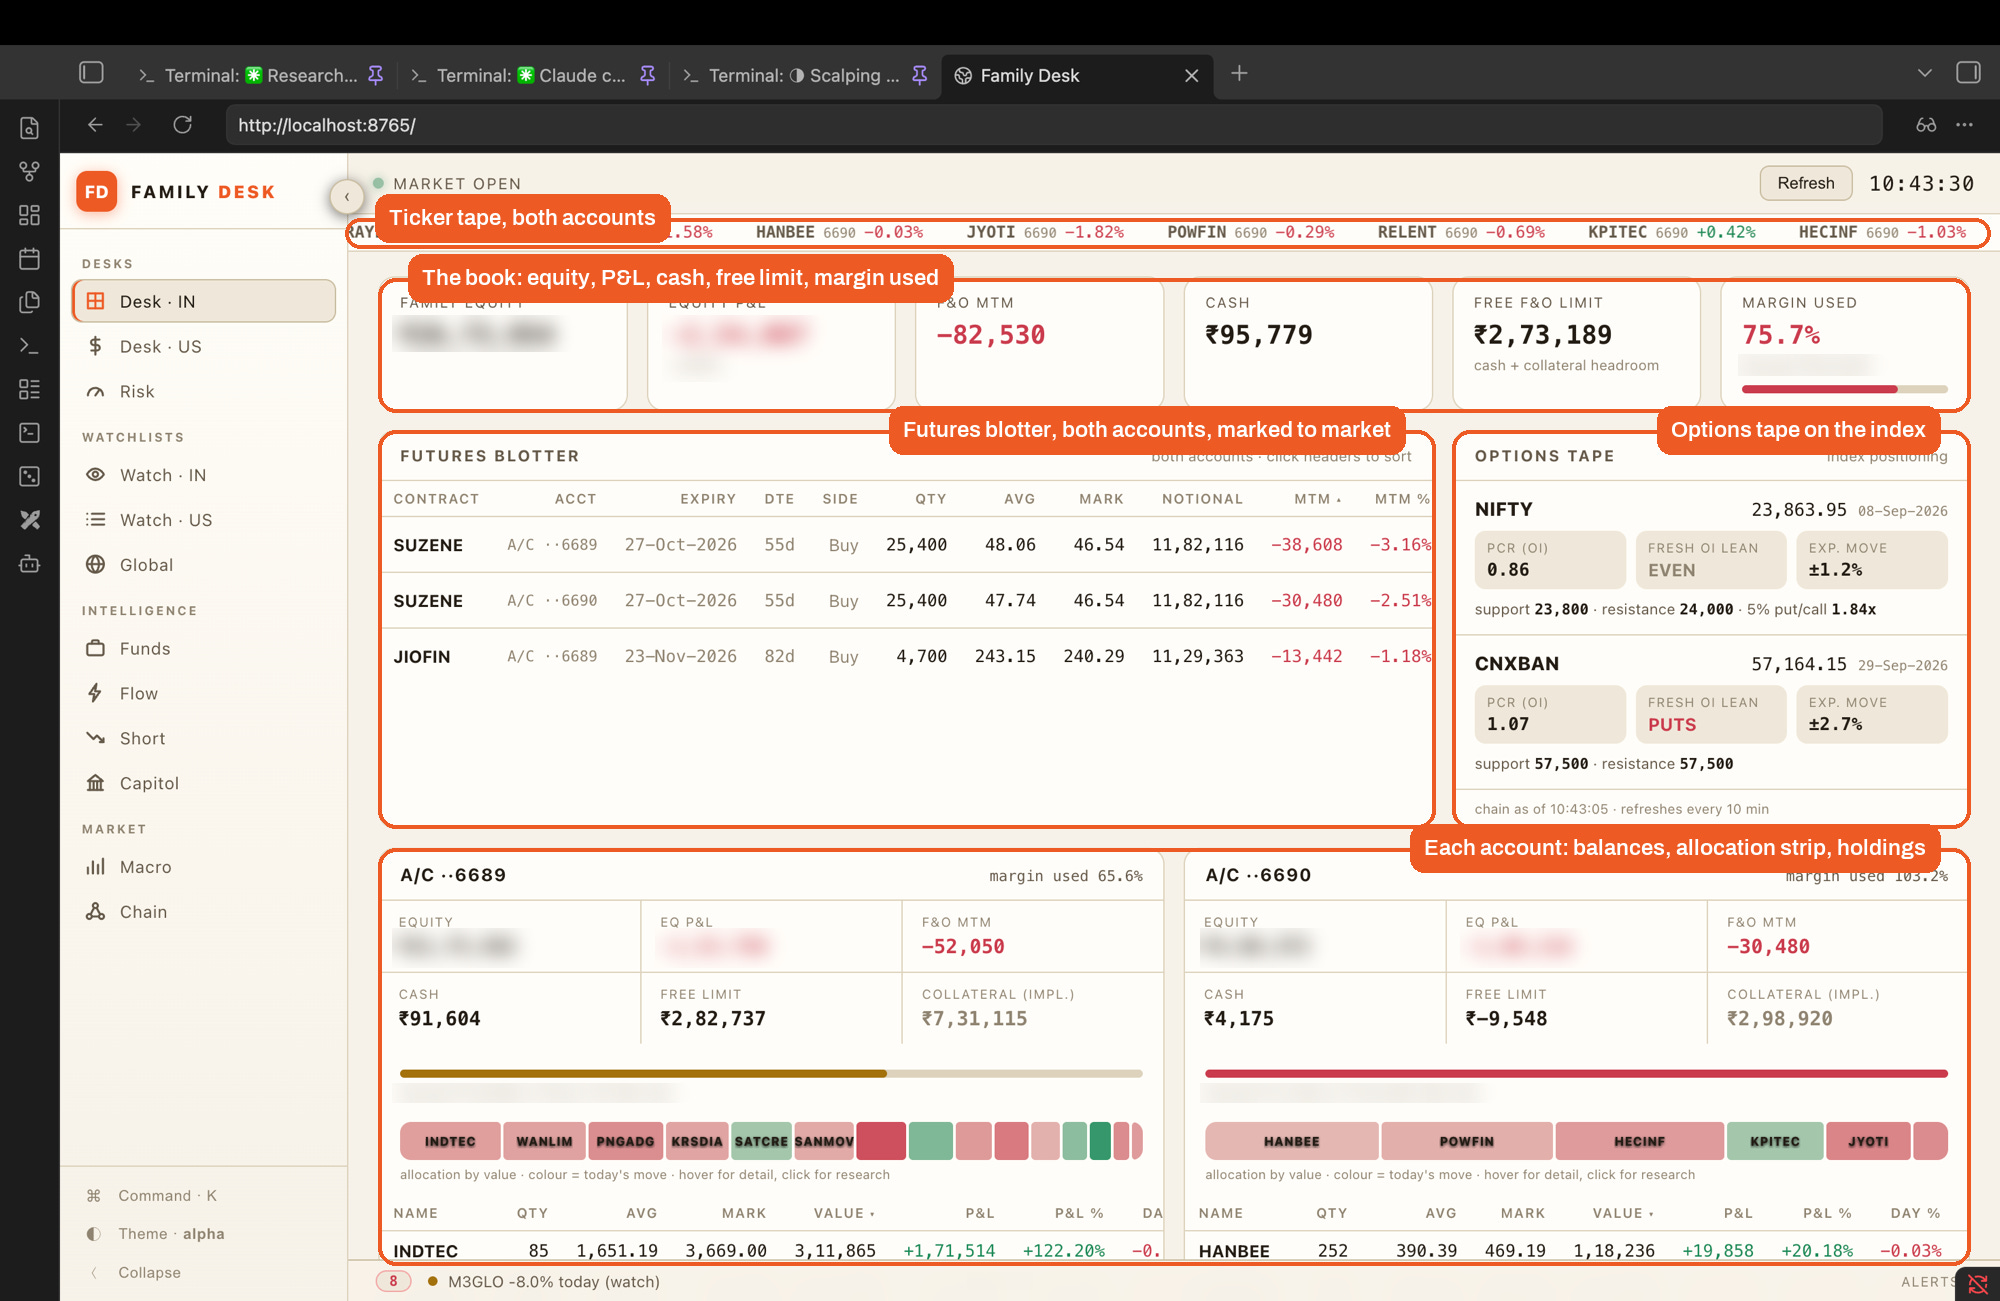
That tab stack was my setup for years, honestly, and I did not think there was another way to do it, because the other way was supposed to belong to institutions. A fund has a Bloomberg terminal or FactSet on every desk, one screen where the positions, the filings, the estimates, the ownership data and the alerts all sit together, and for a long time the assumption was that an individual investor could not have anything like that, because those systems are built for institutions and sold to institutions. That assumption is now wrong. What you are looking at above is a small Bloomberg for one desk, a mini FactSet if you like, with three portfolios across two markets in one window, and every piece of it is a file on my machine. This edition is the whole thing, start to finish, including how each of those tabs got replaced, and you can build it in your own market with your own broker, which is the part I want to get right for you.
Alpha with AI is my full-time work. Paid subscribers get the Research Dives and the model portfolio, with the full research behind every entry. AI Prime is the home of the complete AI workflow library, every edition like this one, archive and new. If this work earns a place in your process, upgrade below.
A Claude Code desk has five layers
Before I walk you through the tabs, I want to give you the map, because without the map the twelve tabs look like twelve more tabs, and that is exactly the thing we are trying to get away from.
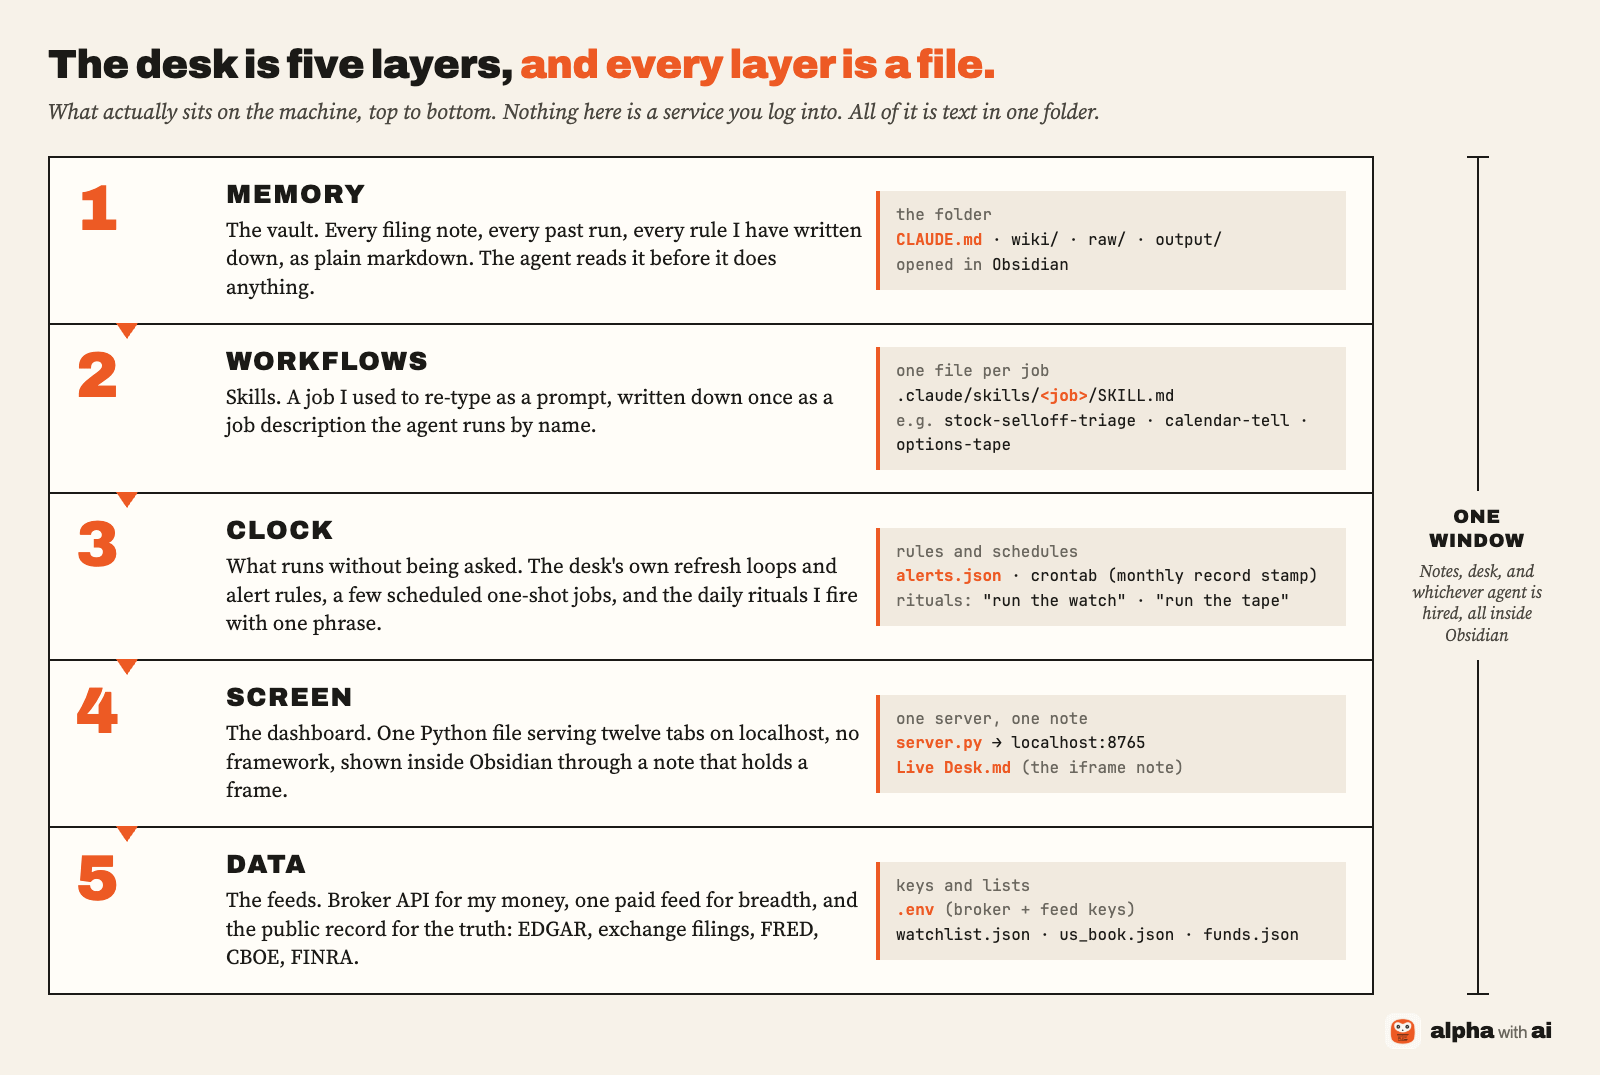
The way I think about it, the desk has five layers. There is a memory, there are workflows, there is a clock, there is a screen, and there is the data underneath, and the thing all five have in common is that none of them is a service I log into. Every one of them is a file, or a folder of files, sitting in one folder on my Mac, and I am going to explain each one properly, so if you have never read the earlier editions you are not missing anything.
The memory is a vault
If you have not used Obsidian, it is a free note-taking app, and the only thing you need to know about it is that a vault is just a folder of plain text files on your computer, written in markdown, which is plain text with a few symbols for headings and links. There is no database and no account behind it, and inside my folder there are four things that matter: a file called CLAUDE.md at the top, which is the standing instruction sheet, how I want things done, where things live, what never goes out; a folder called wiki, where every company I have looked at, every filing note and every rule I have written for myself sits as a note; a folder called raw, the inbox, where anything I clip or drop in lands first; and a folder called output, where everything the desk produces goes.
Around that folder sits a small set of plugins, one that clips any web page into the vault, one that keeps the charts inside the clip, one that opens the agent in a terminal next to your notes, one that opens the desk and any web page inside Obsidian, one that puts the agent in a chat window if you never want a terminal, and a browser the agent drives itself, and every one of them gets installed in the walkthrough near the end, with screenshots, so you do not need the names yet.
The agent that reads all of that is, in my case, Claude Code. If you have not seen it, it is Anthropic’s terminal tool, which sounds technical and is not. You open it on a folder, you type in plain English, and it can read the files in that folder, write new ones, and run programs on your machine. That is the whole difference between it and a chat window: a chat window gives you an answer, and this thing does the work and leaves the result as a file. I open it on the vault, so the vault is what it remembers. Kimi Code, Grok Build and Codex are the same kind of tool from other companies, and I use Kimi Code and Grok Build inside Obsidian as well, sometimes on the same day, and if a terminal is the thing that has kept you away from all of this there is a desktop-app route, which sits in the install section near the end with everything else.
Nothing in this setup is married to Claude. The reason everything is plain text is that any model can read plain text, and the reason the rulebook is one file is that any agent can be told to read it. Claude Code reads CLAUDE.md on its own. The other agents look for a file called agents.md, and my instruction to them is simply to read CLAUDE.md, so there is one rulebook and nothing is locked inside anybody’s product. That was the argument I made in July when I rebuilt the setup for the second time, and it is still the argument.
The workflows are skills
This is the layer the earlier setups never had. A workflow here is a skill, which is a job written down once in a plain text file, the sources, the steps, the checks, the shape of the output, so the agent runs it by name instead of me typing the same instructions every time. And here is the thing about the desk that took me a while to see: most of the twelve tabs are skills too. The Funds tab is a skill that goes to EDGAR and pulls the filings, Capitol is one that reads the Congress disclosures, Short reads FINRA, Macro reads FRED, Flow reads the options chains, and you do not fire any of them, you click the tab and the job runs itself and refreshes on its own, which, honestly, is the coolest part of the whole thing. The few I still fire by name come back in the section on what runs on its own.
The clock runs without me
The clock is everything that runs without me asking, the desk’s own refresh loops, a set of alert rules that ping my Mac when one fires, and the daily rituals I fire with one phrase, and it gets its own section later, including the way to keep all of it running when your laptop is shut.
The screen is the dashboard
The screen is the dashboard you saw at the top, one small program, written by the agent, that shows twelve tabs on my own machine with nothing else to install and nothing to host, and it sits inside Obsidian in a tab like any page, which is why the desk and the notes are in one window. The fifth layer, the data underneath, is the next section, because it is the question everyone asks first and it decides whether this works in your market, and the tour of the tabs comes right after it.
If you want to see how the older versions of this setup looked, the May edition covered the first install and the July edition covered the rebuild, and both are linked at the bottom of this piece, though nothing here depends on them. And one more thing, because a few of you will want to watch this rather than read it: I am recording the whole setup running live, as a video walkthrough, and it goes out as a companion to this piece over the next couple of weeks.
A small note, and the only sponsor here is me. I keep getting messages asking how I set up Claude Code for stock research, beyond what the editions can teach. So I am opening a small consulting program: I set your system up with you, then support sessions over the following months as your real problems show up. I am doing a lot of other things, so seats are very few. If that is you, the waitlist is on the website or reply to this email.
Where the desk’s data comes from
Three places, and they do three different jobs, so let me take them one at a time.
Source one, your broker
It is the only source in the world that knows what you actually own, at what price, with how much margin left. My accounts come through the broker’s own API, which is the door a broker opens so a program can read your account, and the desk reads holdings, positions, funds and margin straight from it. Most brokers can be connected now, through an official API or a connector built for AI agents: Interactive Brokers almost everywhere, Schwab, Alpaca and Robinhood in the US, with Robinhood’s new connection built for AI agents specifically, read access to your accounts and orders kept inside a separate account you fund for it, Trading 212 and Saxo in Europe and the UK, Zerodha, ICICI and the other large brokers in India, Questrade in Canada. Where a broker offers no connection, a small text file with your positions does the job and the desk prices it live. You connect whichever broker you have.
Source two, an optional feed
This is the one everyone assumes is the whole game, and it is not. A feed gives you breadth: screening across a few thousand names, years of price history, peers, analyst estimates, and the financial statements already parsed into rows. There are many providers, and you check the ones that cover your market. I use Financial Modeling Prep because I only need it for US names and its US data is good, on its cheapest plan, and the plans above it add Canada, the UK and then global coverage. The reason I pay for a feed at all is that I look at financials and ratios on different names all day, and I do not want the agent spending one minute, two minutes, five minutes fetching a new company every single time. For names the feed does not cover, that is exactly what happens, and it works: the agent opens a real browser through Playwright, which is a browser it drives itself, and reads the numbers off the exchange site or a site like Screener.in, or uses its own fetching tools, and if you want a service built for reading web pages in bulk, Firecrawl has a free monthly quota and a paid plan above it. So the feed is a convenience, not a requirement. If you do not want one, skip to source three, and nothing breaks.
Source three, the filing itself
Every market has a public disclosure system. In the US it is EDGAR, the SEC’s filing database, where every annual report, the 10-K, sits the day it is filed, and everywhere else there is an equivalent, the exchange portal, the regulator’s site, the annual report on the company’s own page. It is free, it is the primary record, and until recently it was expensive to use, because reading a two-hundred-page filing takes an afternoon, which is why everyone bought the feed instead, and now the agent reads it.
Let me show you, because this is the button every one of you can click. Here is the prompt, exactly as I ran it the first time:
Pull S&P Global's 10-K filings from EDGAR. Give me five years of revenue, operating profit, net income, diluted EPS, operating cash flow, capex, buybacks, year-end cash and diluted shares. Put the accession number of the filing each figure came from next to it.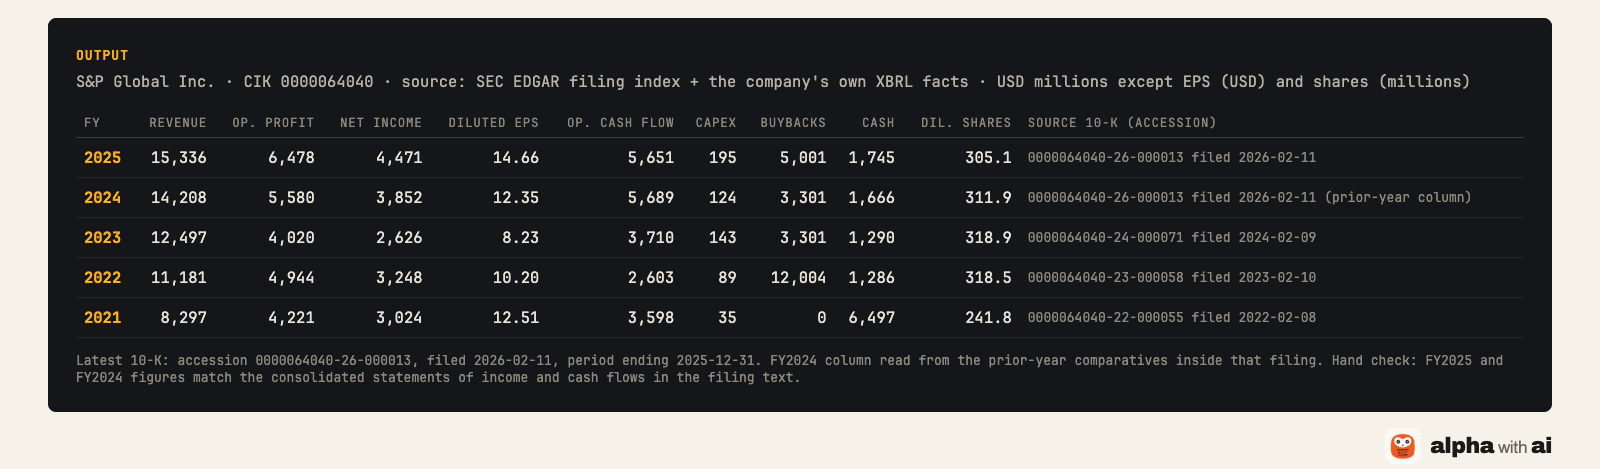
What the run did, in plain words, is this. It asked the SEC’s filing index for S&P Global’s annual reports, it took each number from the tagged data the company itself files with the report, and it wrote the accession number next to each one. The accession number is the filing’s serial number on EDGAR, so anyone can open the exact document a figure came from, and I did exactly that for the 2025 and 2024 columns, checked them against the statement pages in the 10-K, and they match. The whole thing took a few seconds, with no subscription and no login.
The second time, just the name
Now, the part that matters more than the prompt, and I want to be careful here, because those nine items are mine, not a standard. I typed that prompt in full once. The second time, I typed “analyse S&P Global”, and the agent did all of it on its own, because the job was now written down in the setup. And the job is whatever your framework is. If you read a company top-down from the industry, or bottom-up from the unit economics, if there are twelve ratios you always want first or three sections you read before anything else, you tell the agent once, you tell it to remember, and from then on “analyse” means your method, on every company you hand it. It does not fit you to a fixed list. It fits itself to you. That is the difference between this and a tool like Koyfin or Finviz. Those give you their features and you fit your process to them. Here the features get built around your process, and next week it adds whatever you ask for, which is why my setup is completely different from yours and both are right. That is the whole point.
And it keeps getting better, which nobody tells you. It makes mistakes. It misses something you needed, or it gives you something extra you did not ask for, and sometimes that extra thing is the useful one. You give it the feedback, it fixes the instruction, and it does not make that mistake again, and this goes on every day, so my setup today is better than it was a month ago and a month from now it will be better again, and every model upgrade makes the same folder sharper. The closest thing I can compare it to is having an analyst of your own who thinks like you and works like you, gets something wrong now and then, and actually improves when you tell them.
Say you are in the UK, or Dubai, or anywhere else. You do not even have to tell it where the filings live. The first time, it works out the portal on its own, the exchange, the regulator, the company’s own site, it pulls your list, and the reference is whatever that market uses, a filing link, a page number, instead of an accession number. Once it has done that correctly once, you tell it to remember, and that is the standing method for that market.
So the rule I run the desk on is that the broker knows your money, the feed, if you have one, tells you where to look, and the filing decides what is true, and I do not let the first two overrule the third.
The Funds tab runs the same way
The desk itself is built on that rule, not just the demo, and the Funds tab is the cleanest example, because it does not touch the paid feed at all. Every card on it is a 13F filing, the quarterly form where large funds disclose their US holdings, read straight from EDGAR, the same free public record as the 10-K above. And the way it got built is what I want you to take away. Once the dashboard existed, I told the agent, in plain English, something very close to this: here is the list of funds I follow, go to EDGAR, pull each one’s latest 13F, show me the top holdings with the weights, compare it with the previous quarter and show me what is new, what was sold, what was added to and what was trimmed, and pick up the new filing when it lands. That was the instruction. It built the tab, and the list of funds sits in a small file I can edit whenever I want to follow someone new.
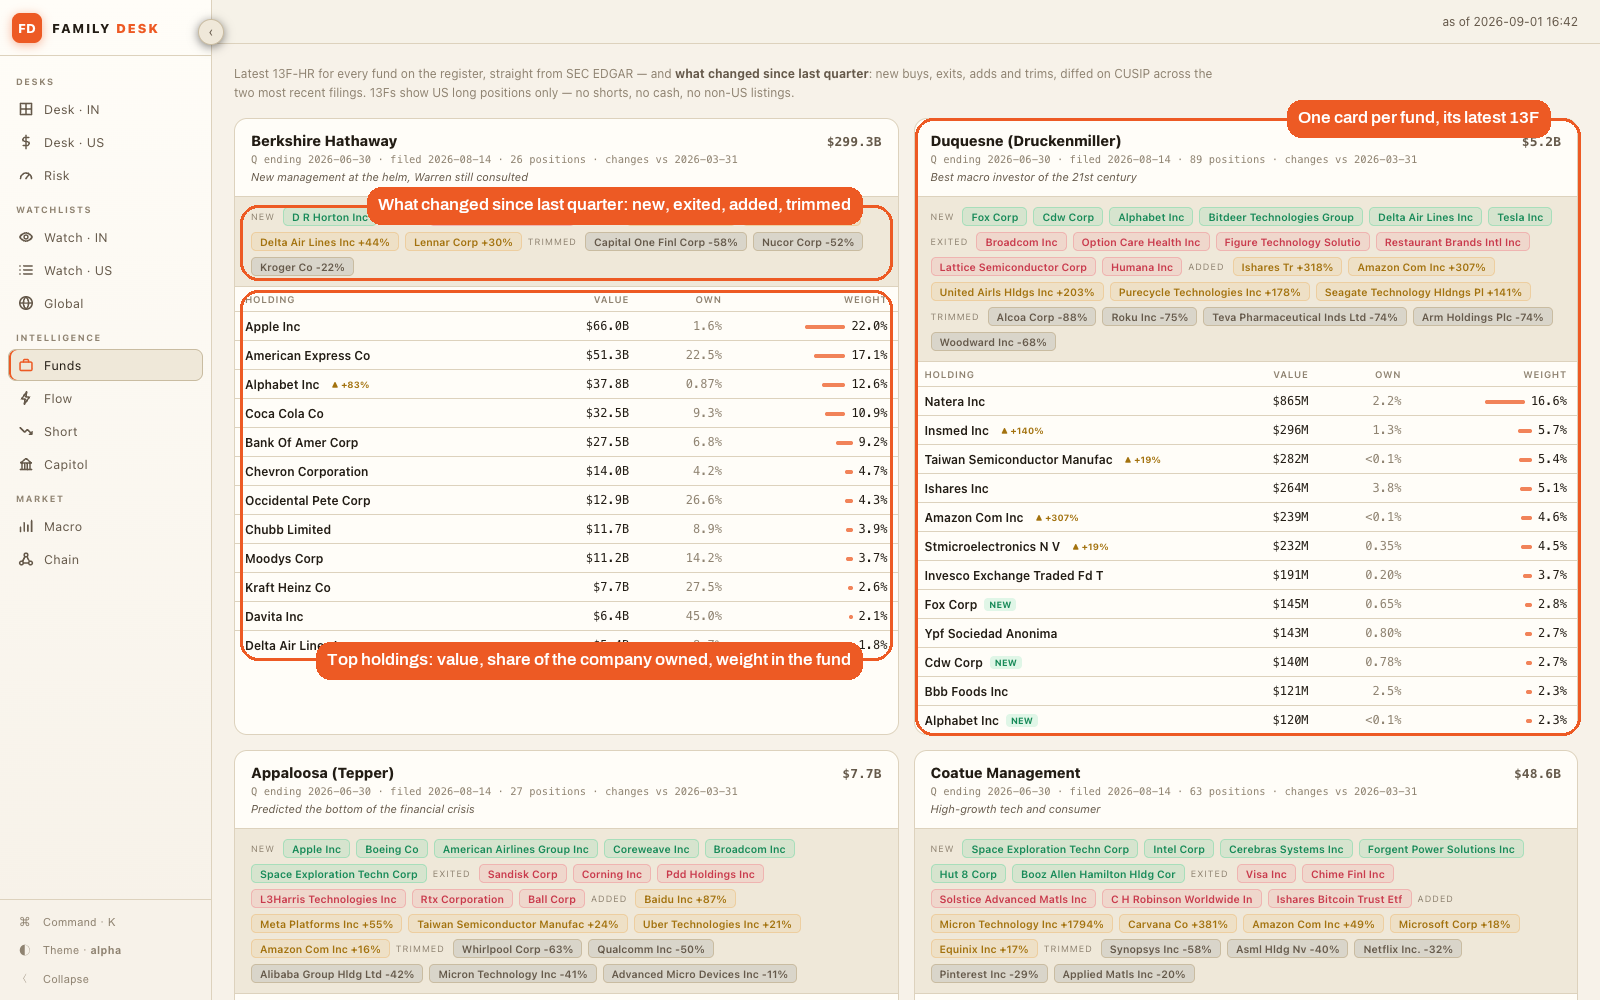
Take one card so you can see what it actually holds. Druckenmiller’s Duquesne filed its quarter ending June 30, 2026 on August 14, 89 positions, about 5.2 billion dollars, and the card reads the two most recent filings against each other. New this quarter: Fox, CDW, Alphabet, Bitdeer, Delta, Tesla. Exited: Broadcom, Option Care Health, Figure Technology, Restaurant Brands, Lattice Semiconductor, Humana. Added to, and read these percentages carefully, because they are how much bigger the fund’s position got, not how the stock moved: the iShares position is 318 percent larger than last quarter, the Amazon position 307 percent larger, United Airlines 203 percent, PureCycle 178 percent, Seagate 141 percent. Trimmed, same measure: the Alcoa position cut by 88 percent, Roku by 75 percent, Teva by 74 percent, Arm by 74 percent. Under that sit the top holdings with the fund’s weight and what share of each company it owns. Every one of those lines came out of two public filings and a comparison, and it is there for every fund on the list, every quarter, without opening WhaleWisdom again. It is not a view on any of those names. It is what the filing says.
What the twelve tabs show
So this is the tour, tab by tab, and I am keeping each one to what it shows and what it reads, because the desk is the point here and not any one number on any one screen. Two of the tabs you have already met, the first desk at the very top of this piece and the Funds tab in the last section, so I will not walk them again.
The two desks, priced live
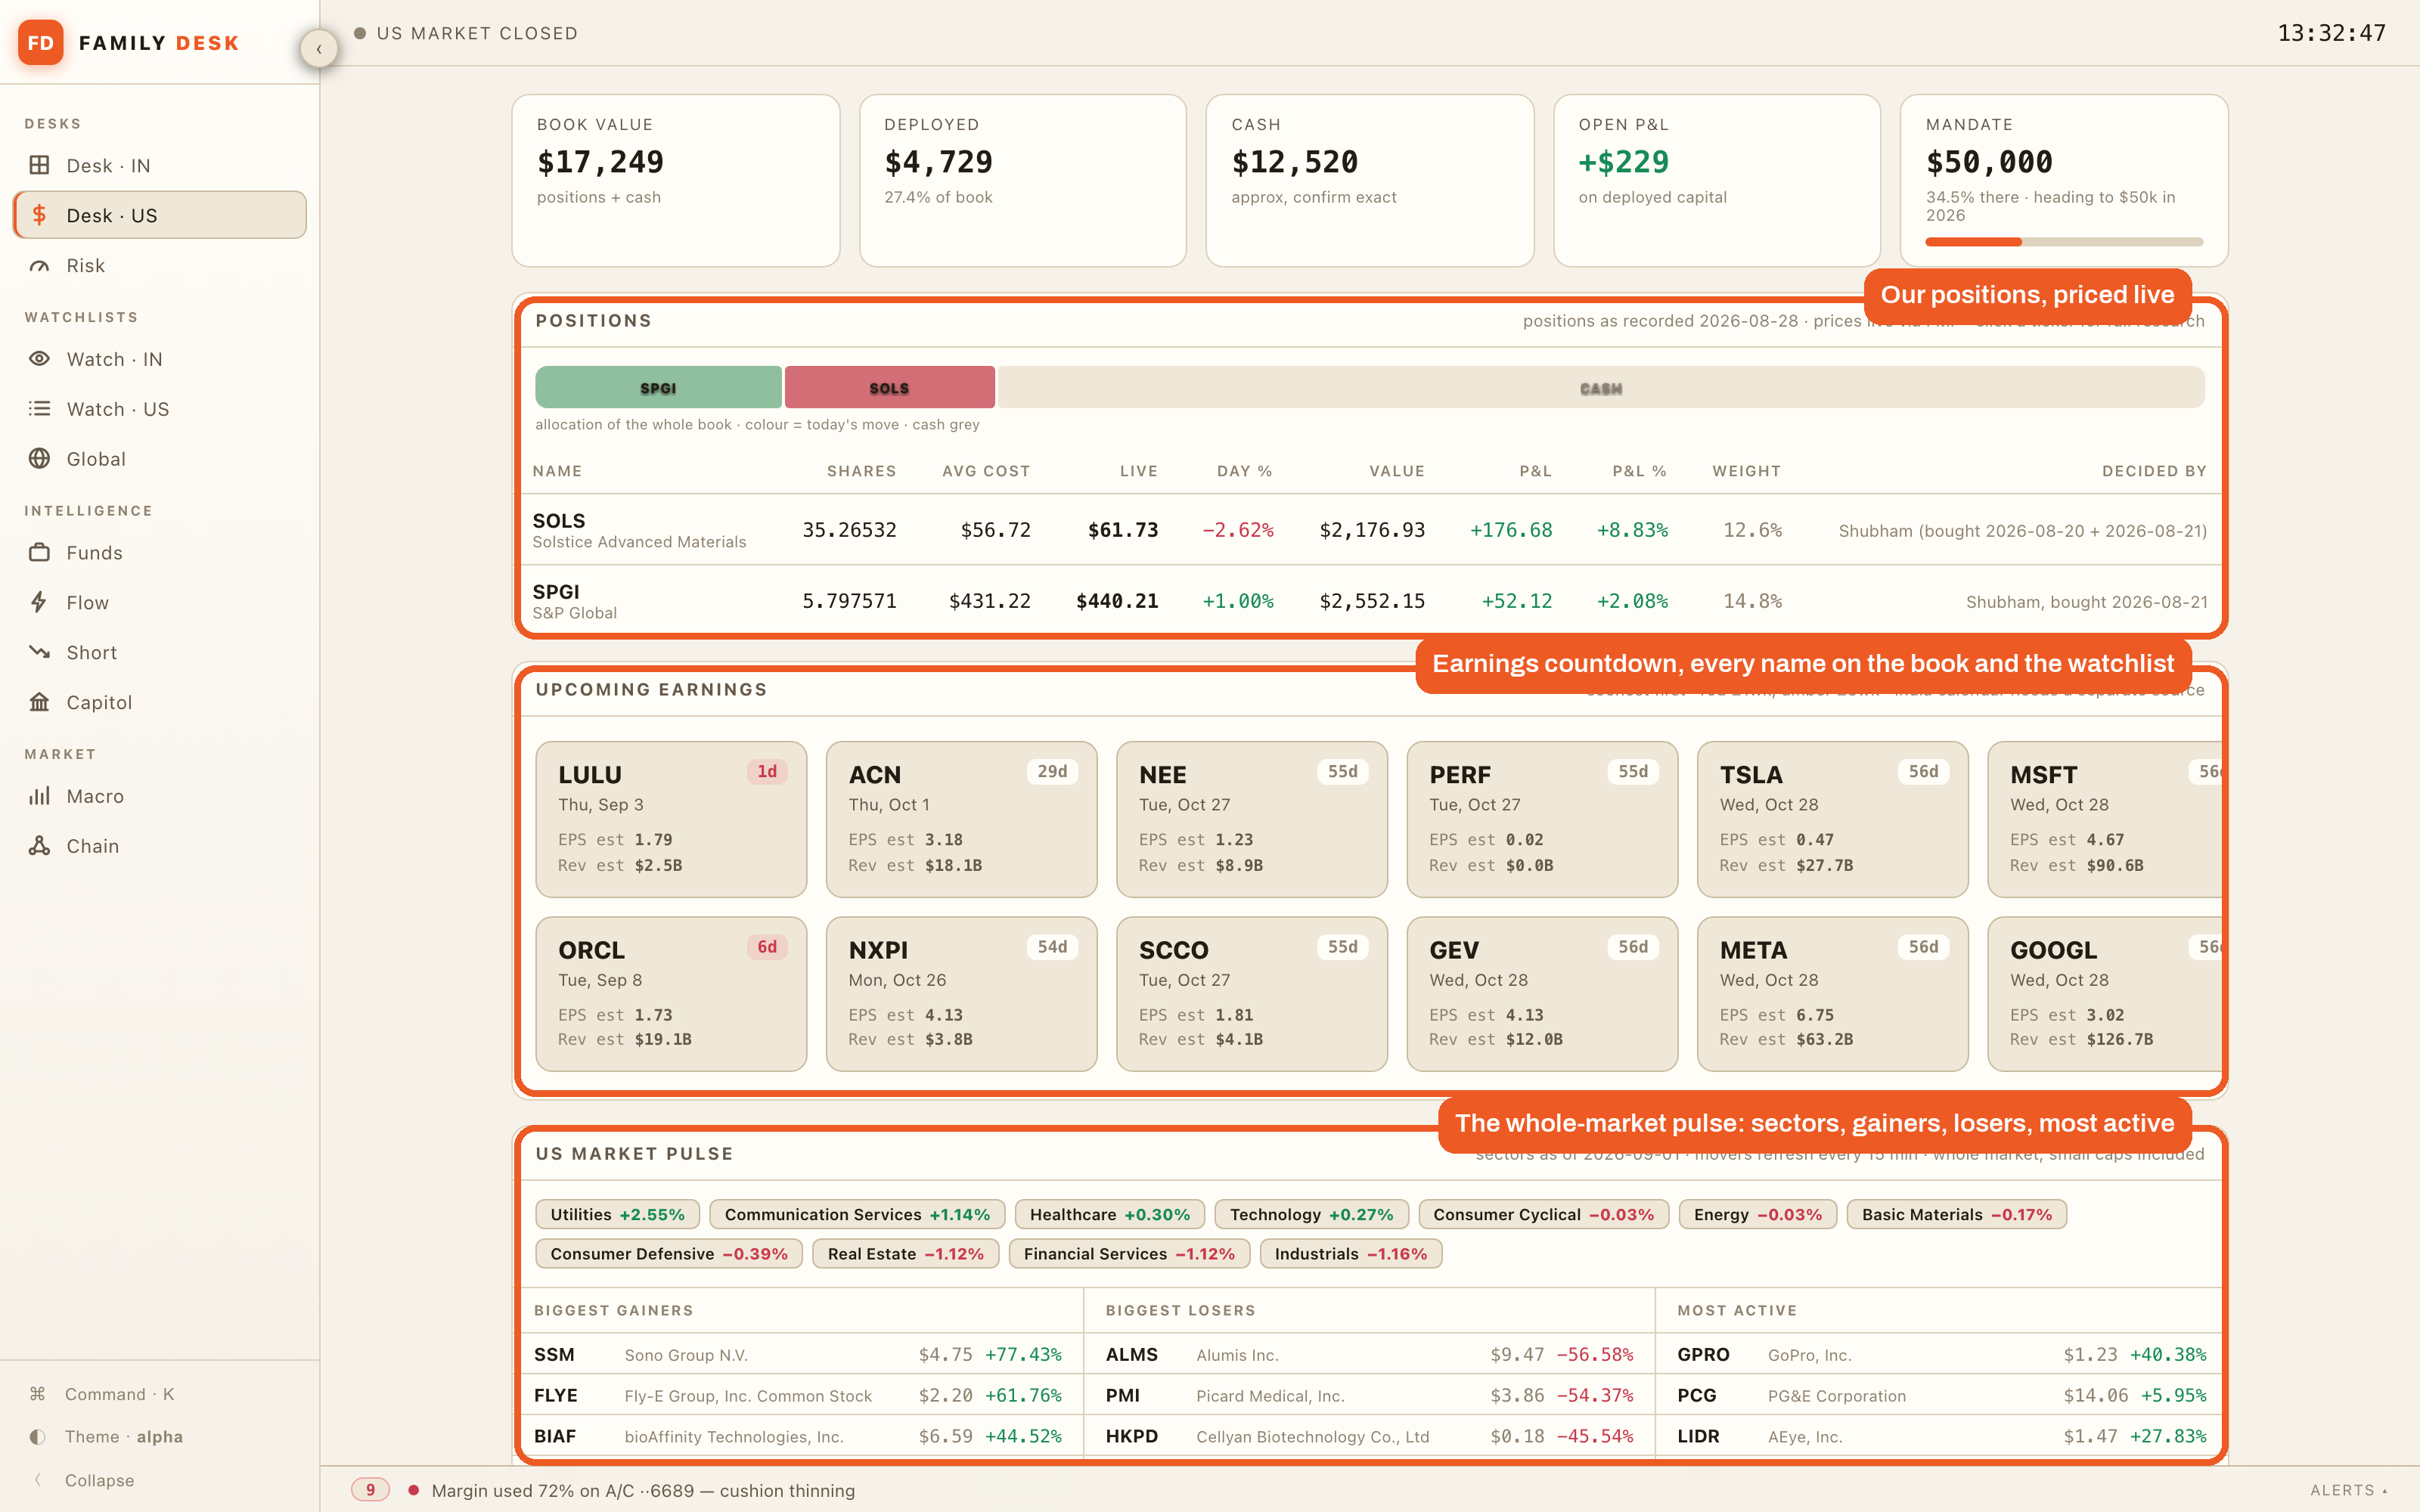
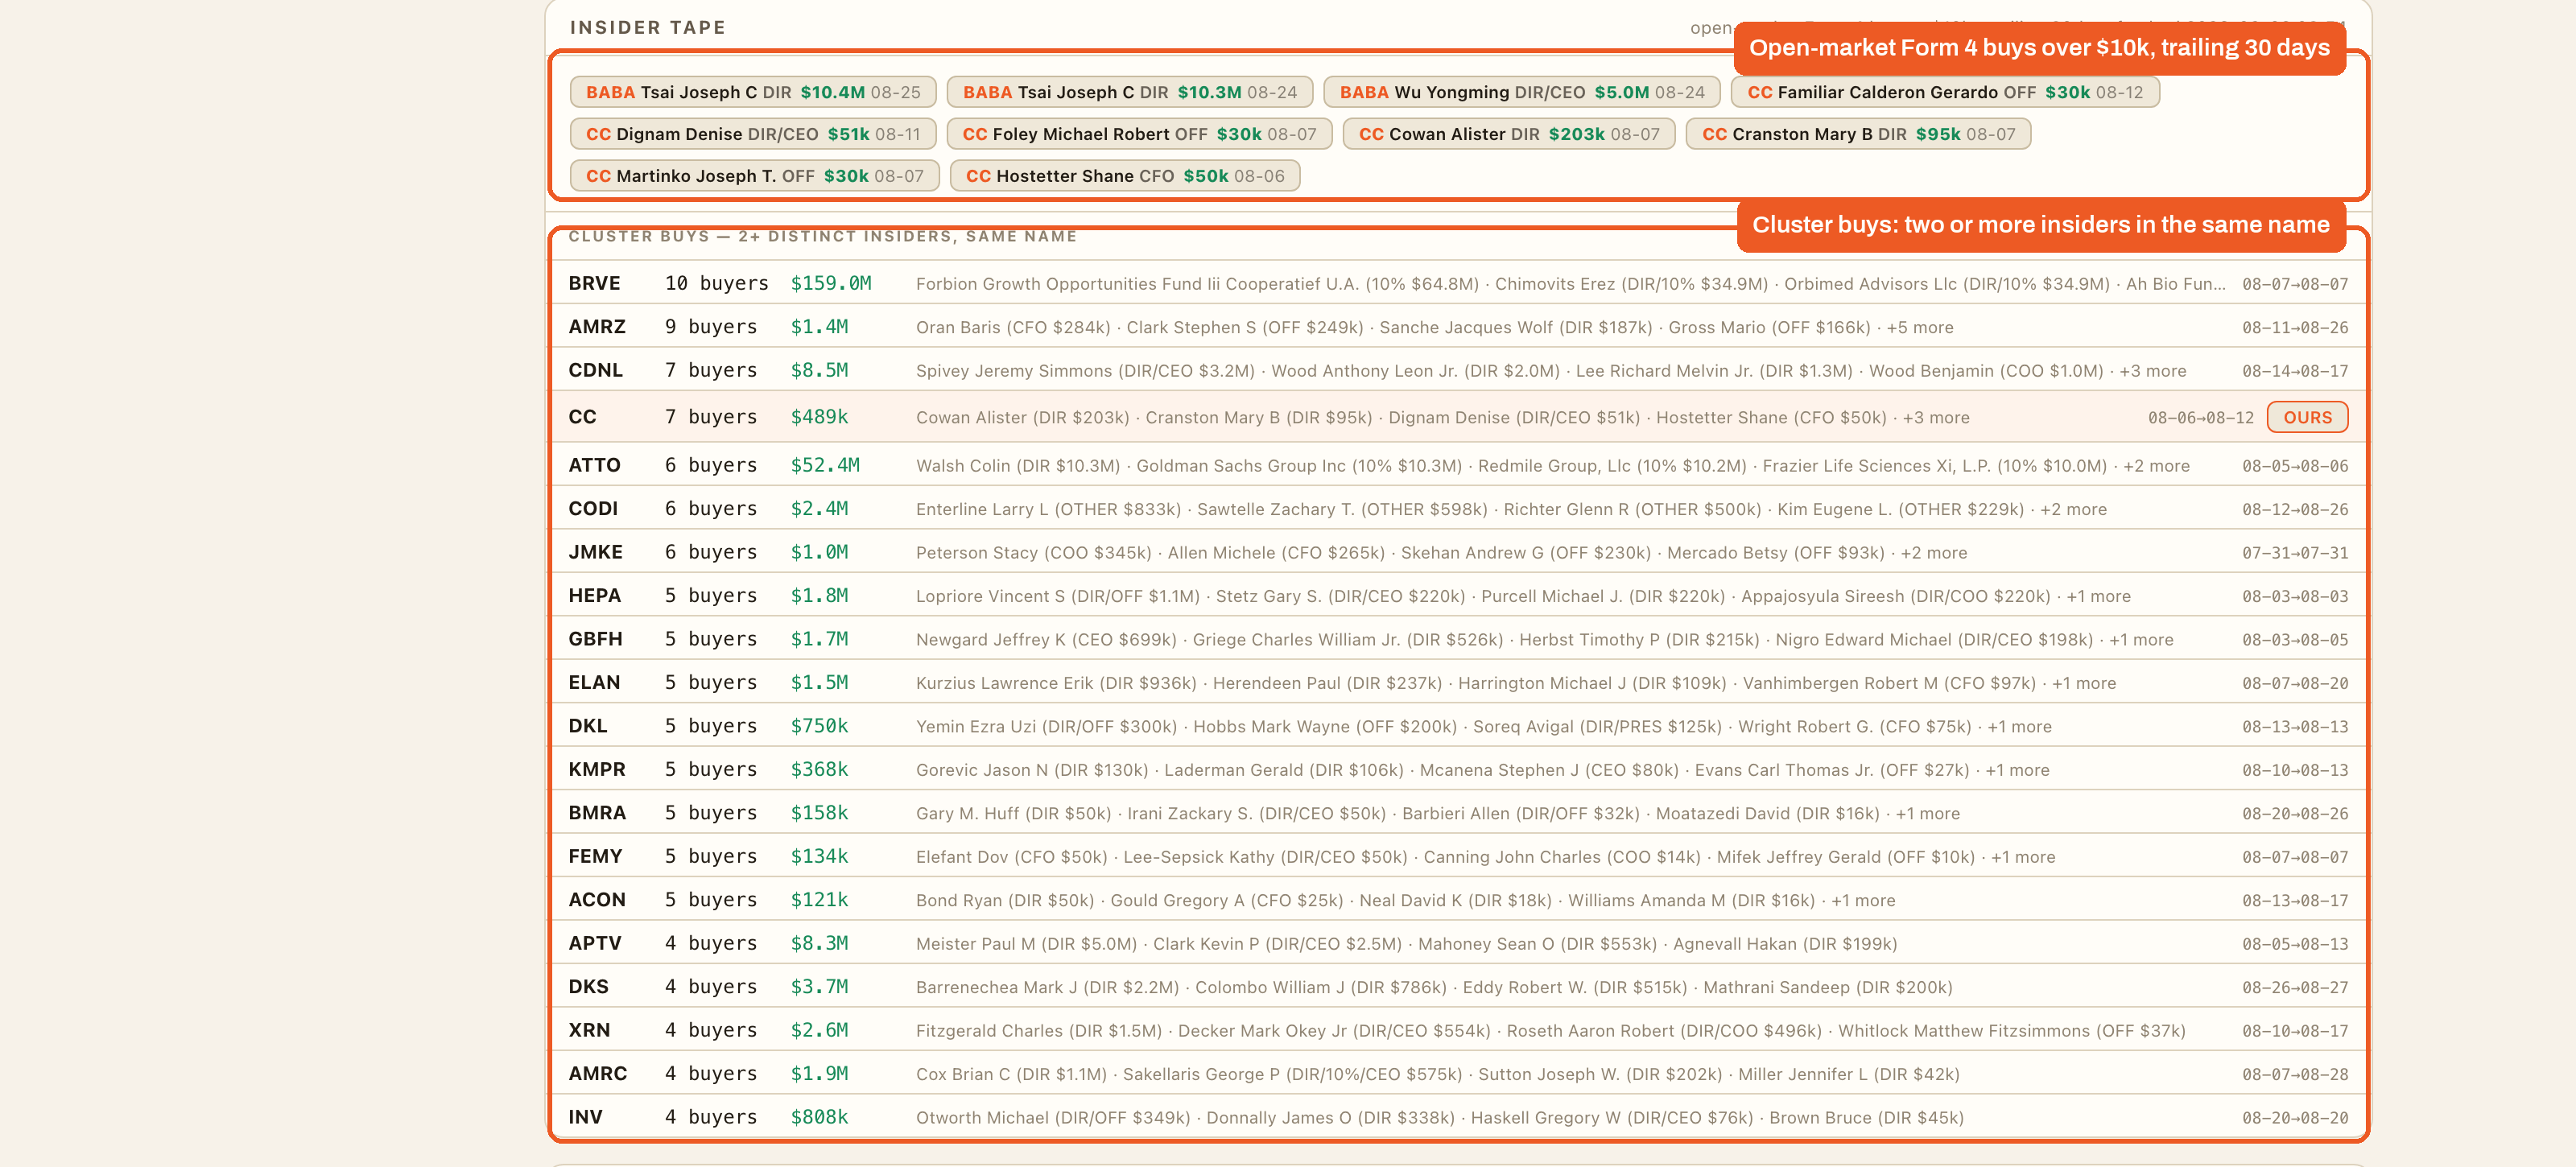
The first desk you saw in the cold open, both accounts with the futures positions, the options tape on the index and the margin bars. The second desk is our US account, and it has three parts, the positions at the top, priced live, the earnings countdown for every name on the book and the watchlist, and a pulse of the whole US market, and further down the same page an insider tape off the Form 4 filings, which are the forms insiders file when they buy or sell their own stock, with the cluster buys under it, where two or more insiders bought the same name in the same window, which is the one insider pattern I actually act on. Any ticker on any of these pages is one click away from its own research page, which is the next section.
Three watchlists, one grid each
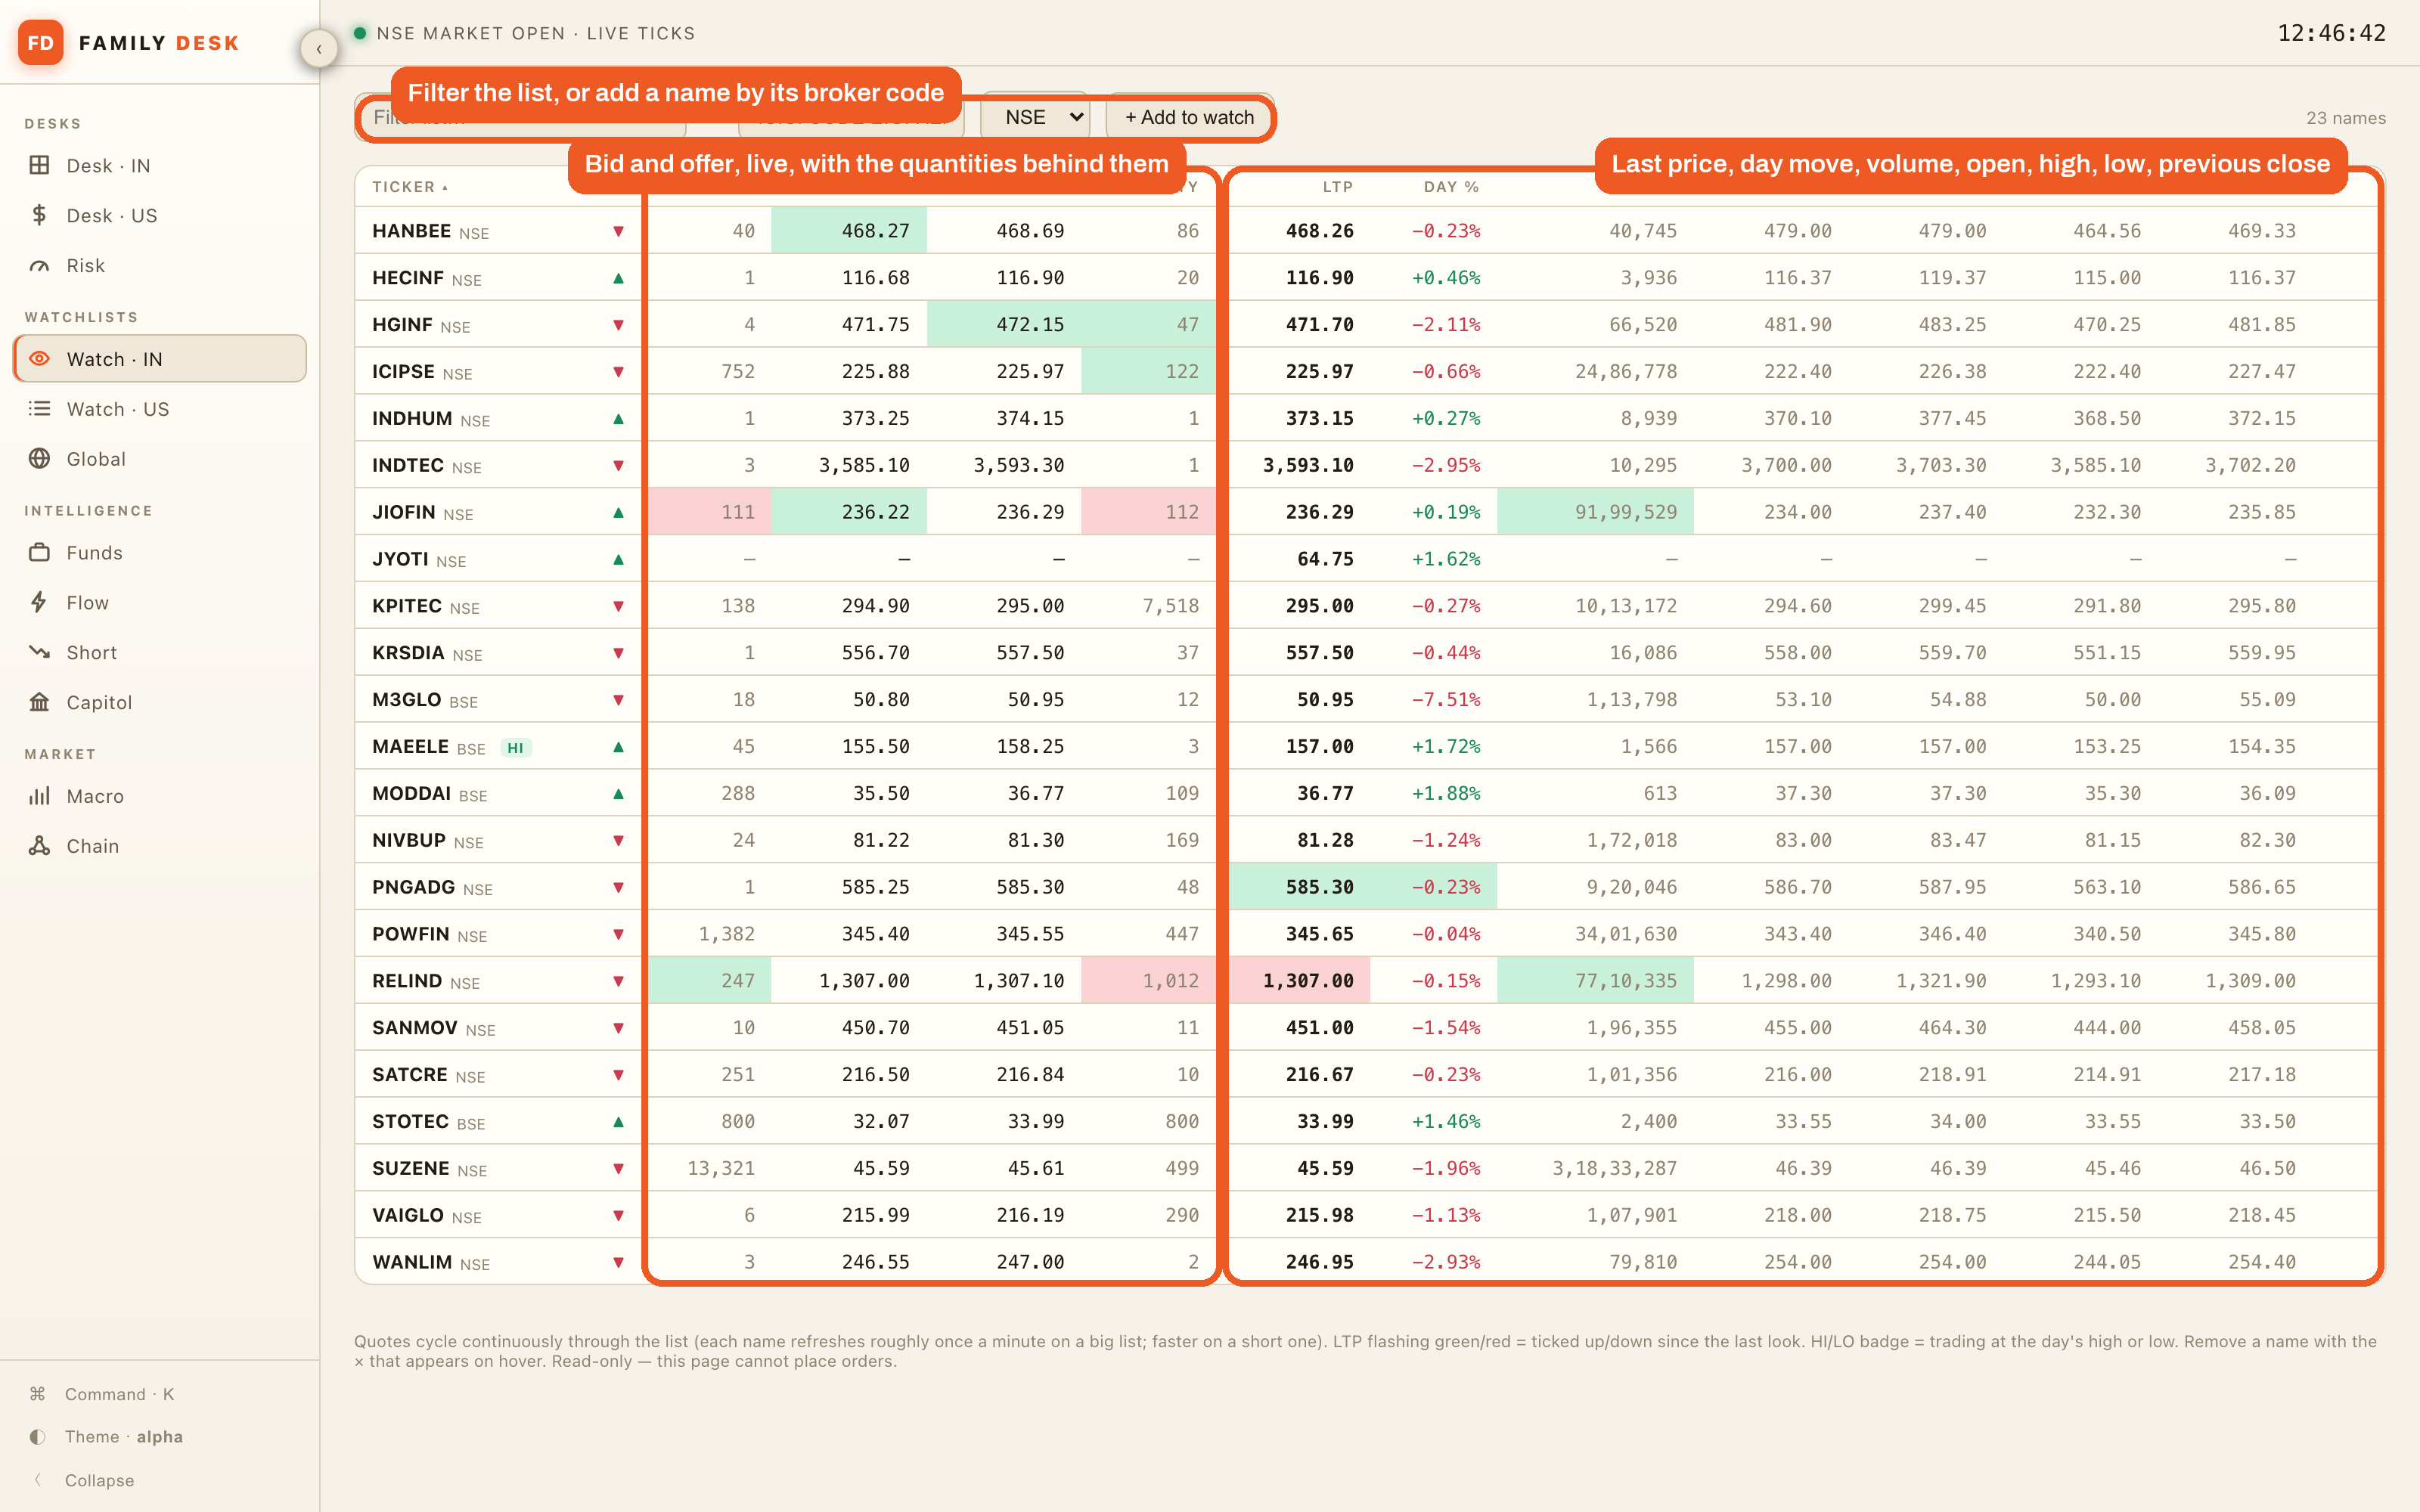
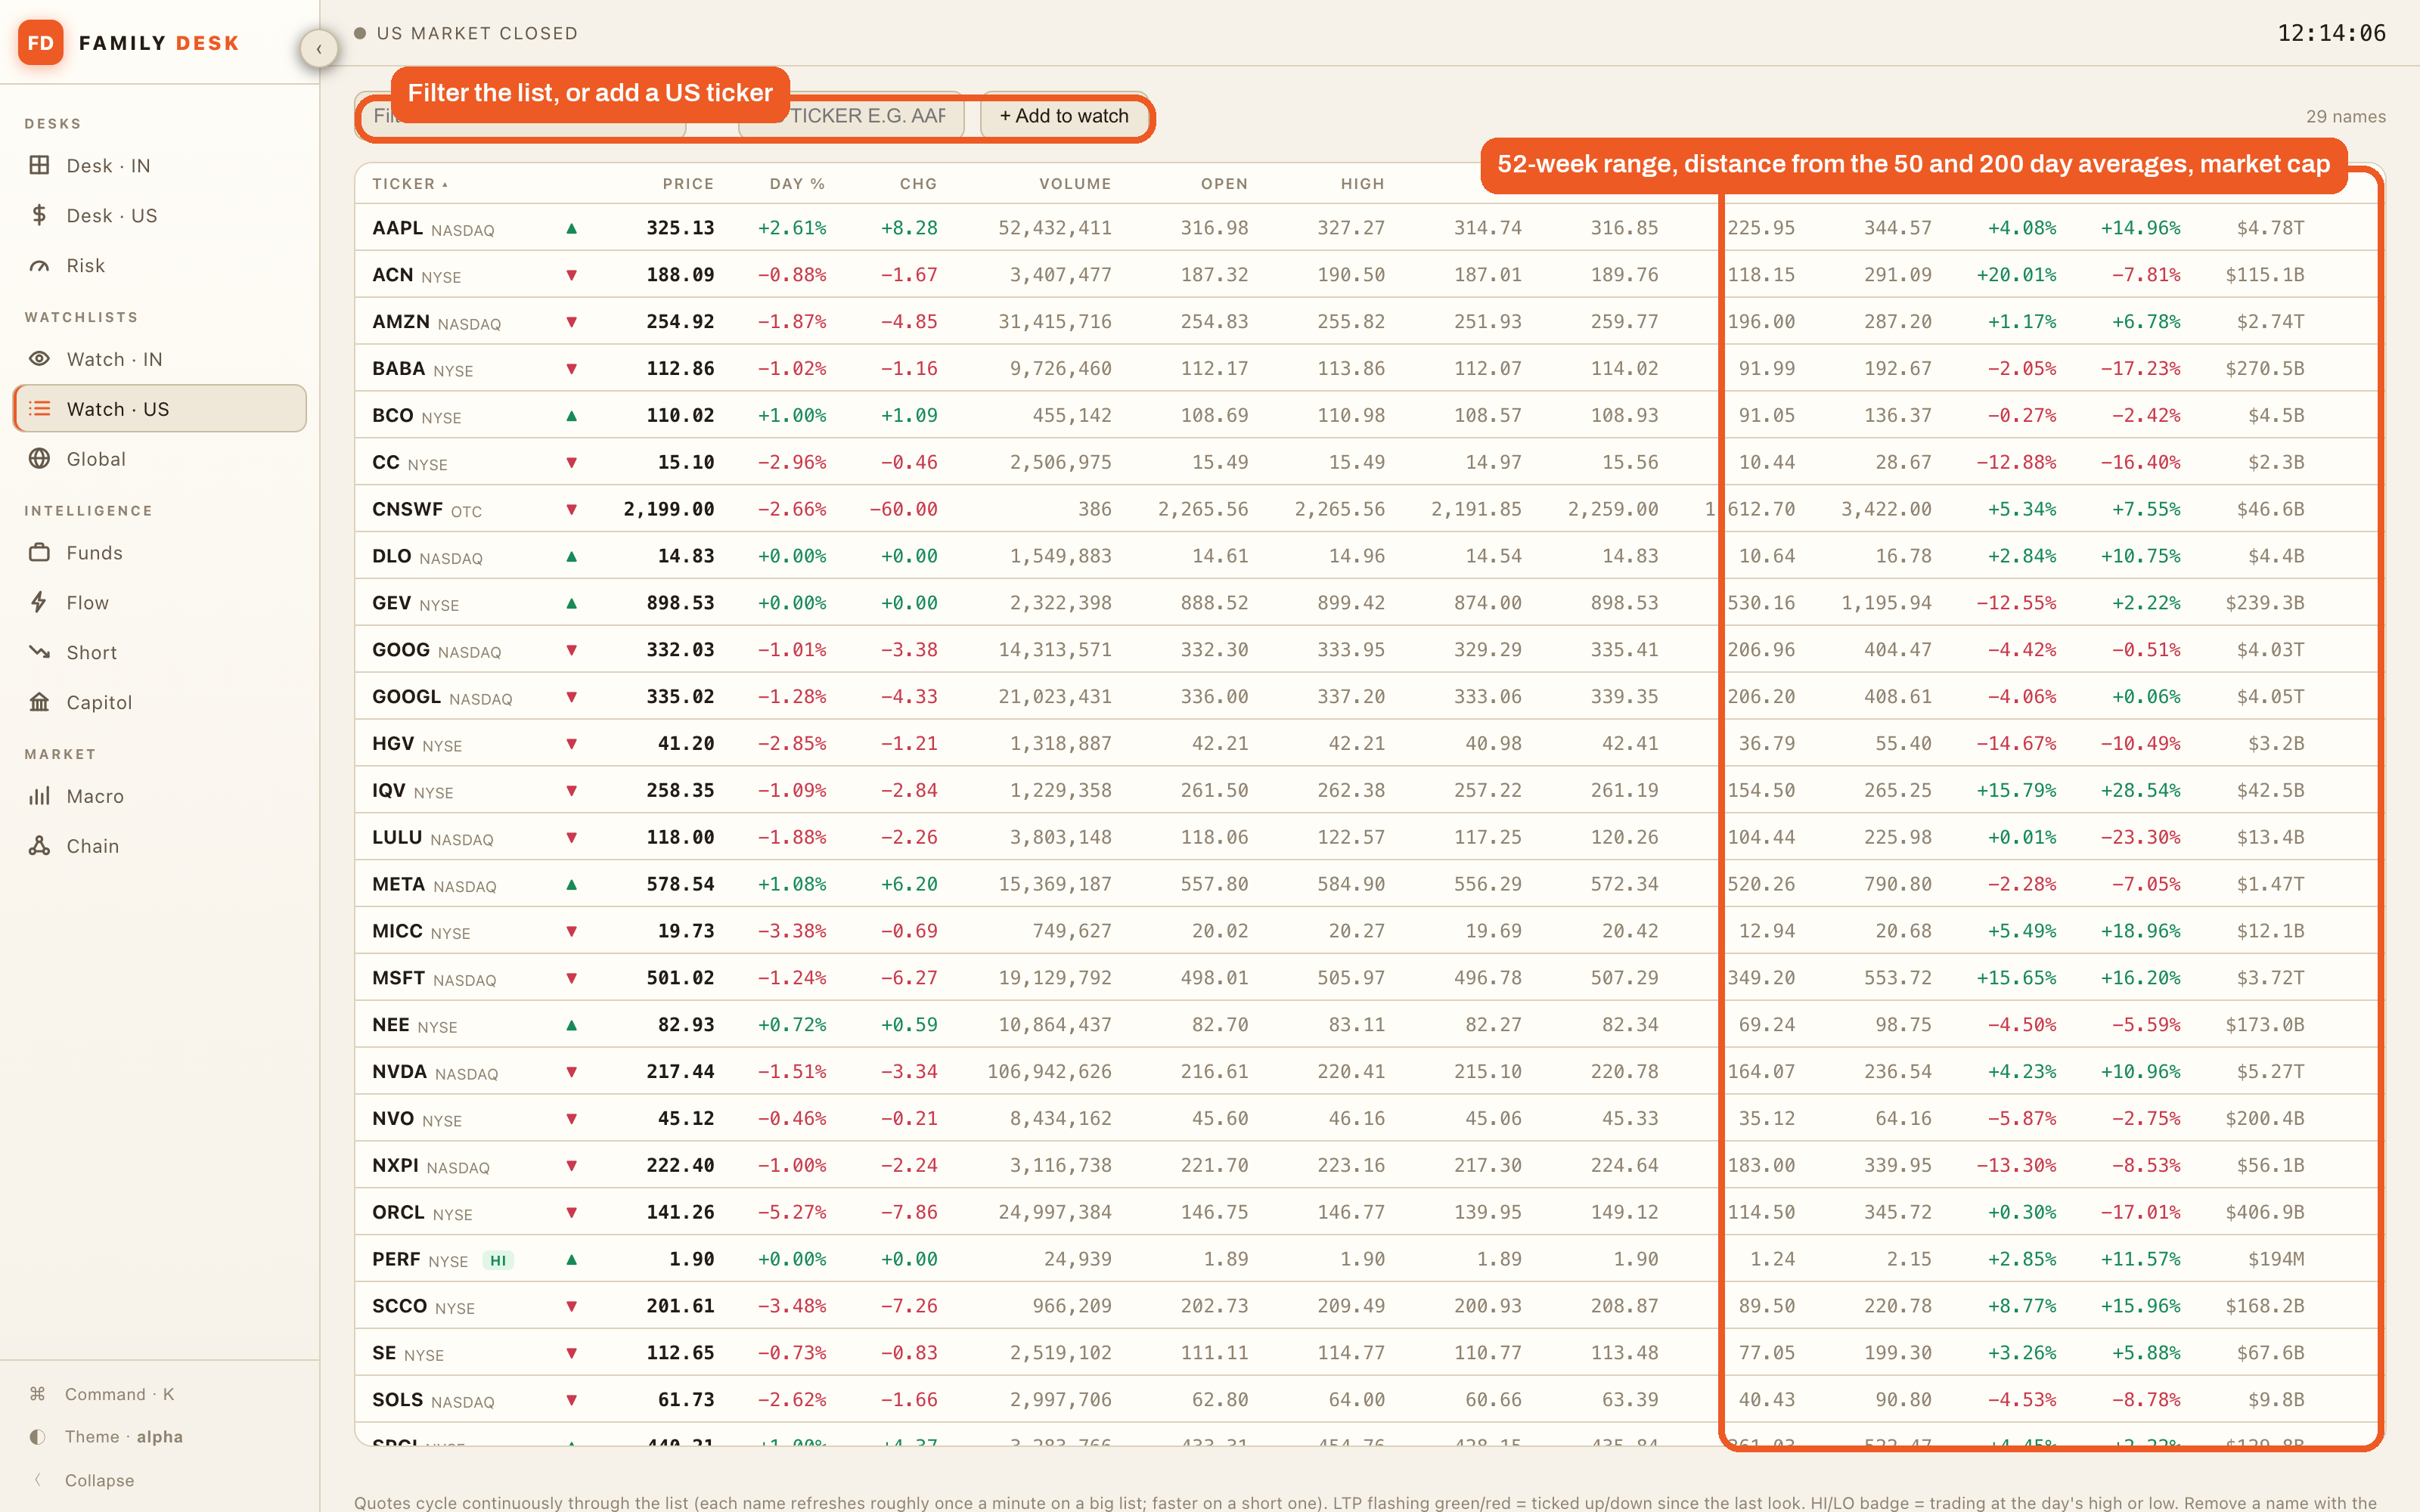
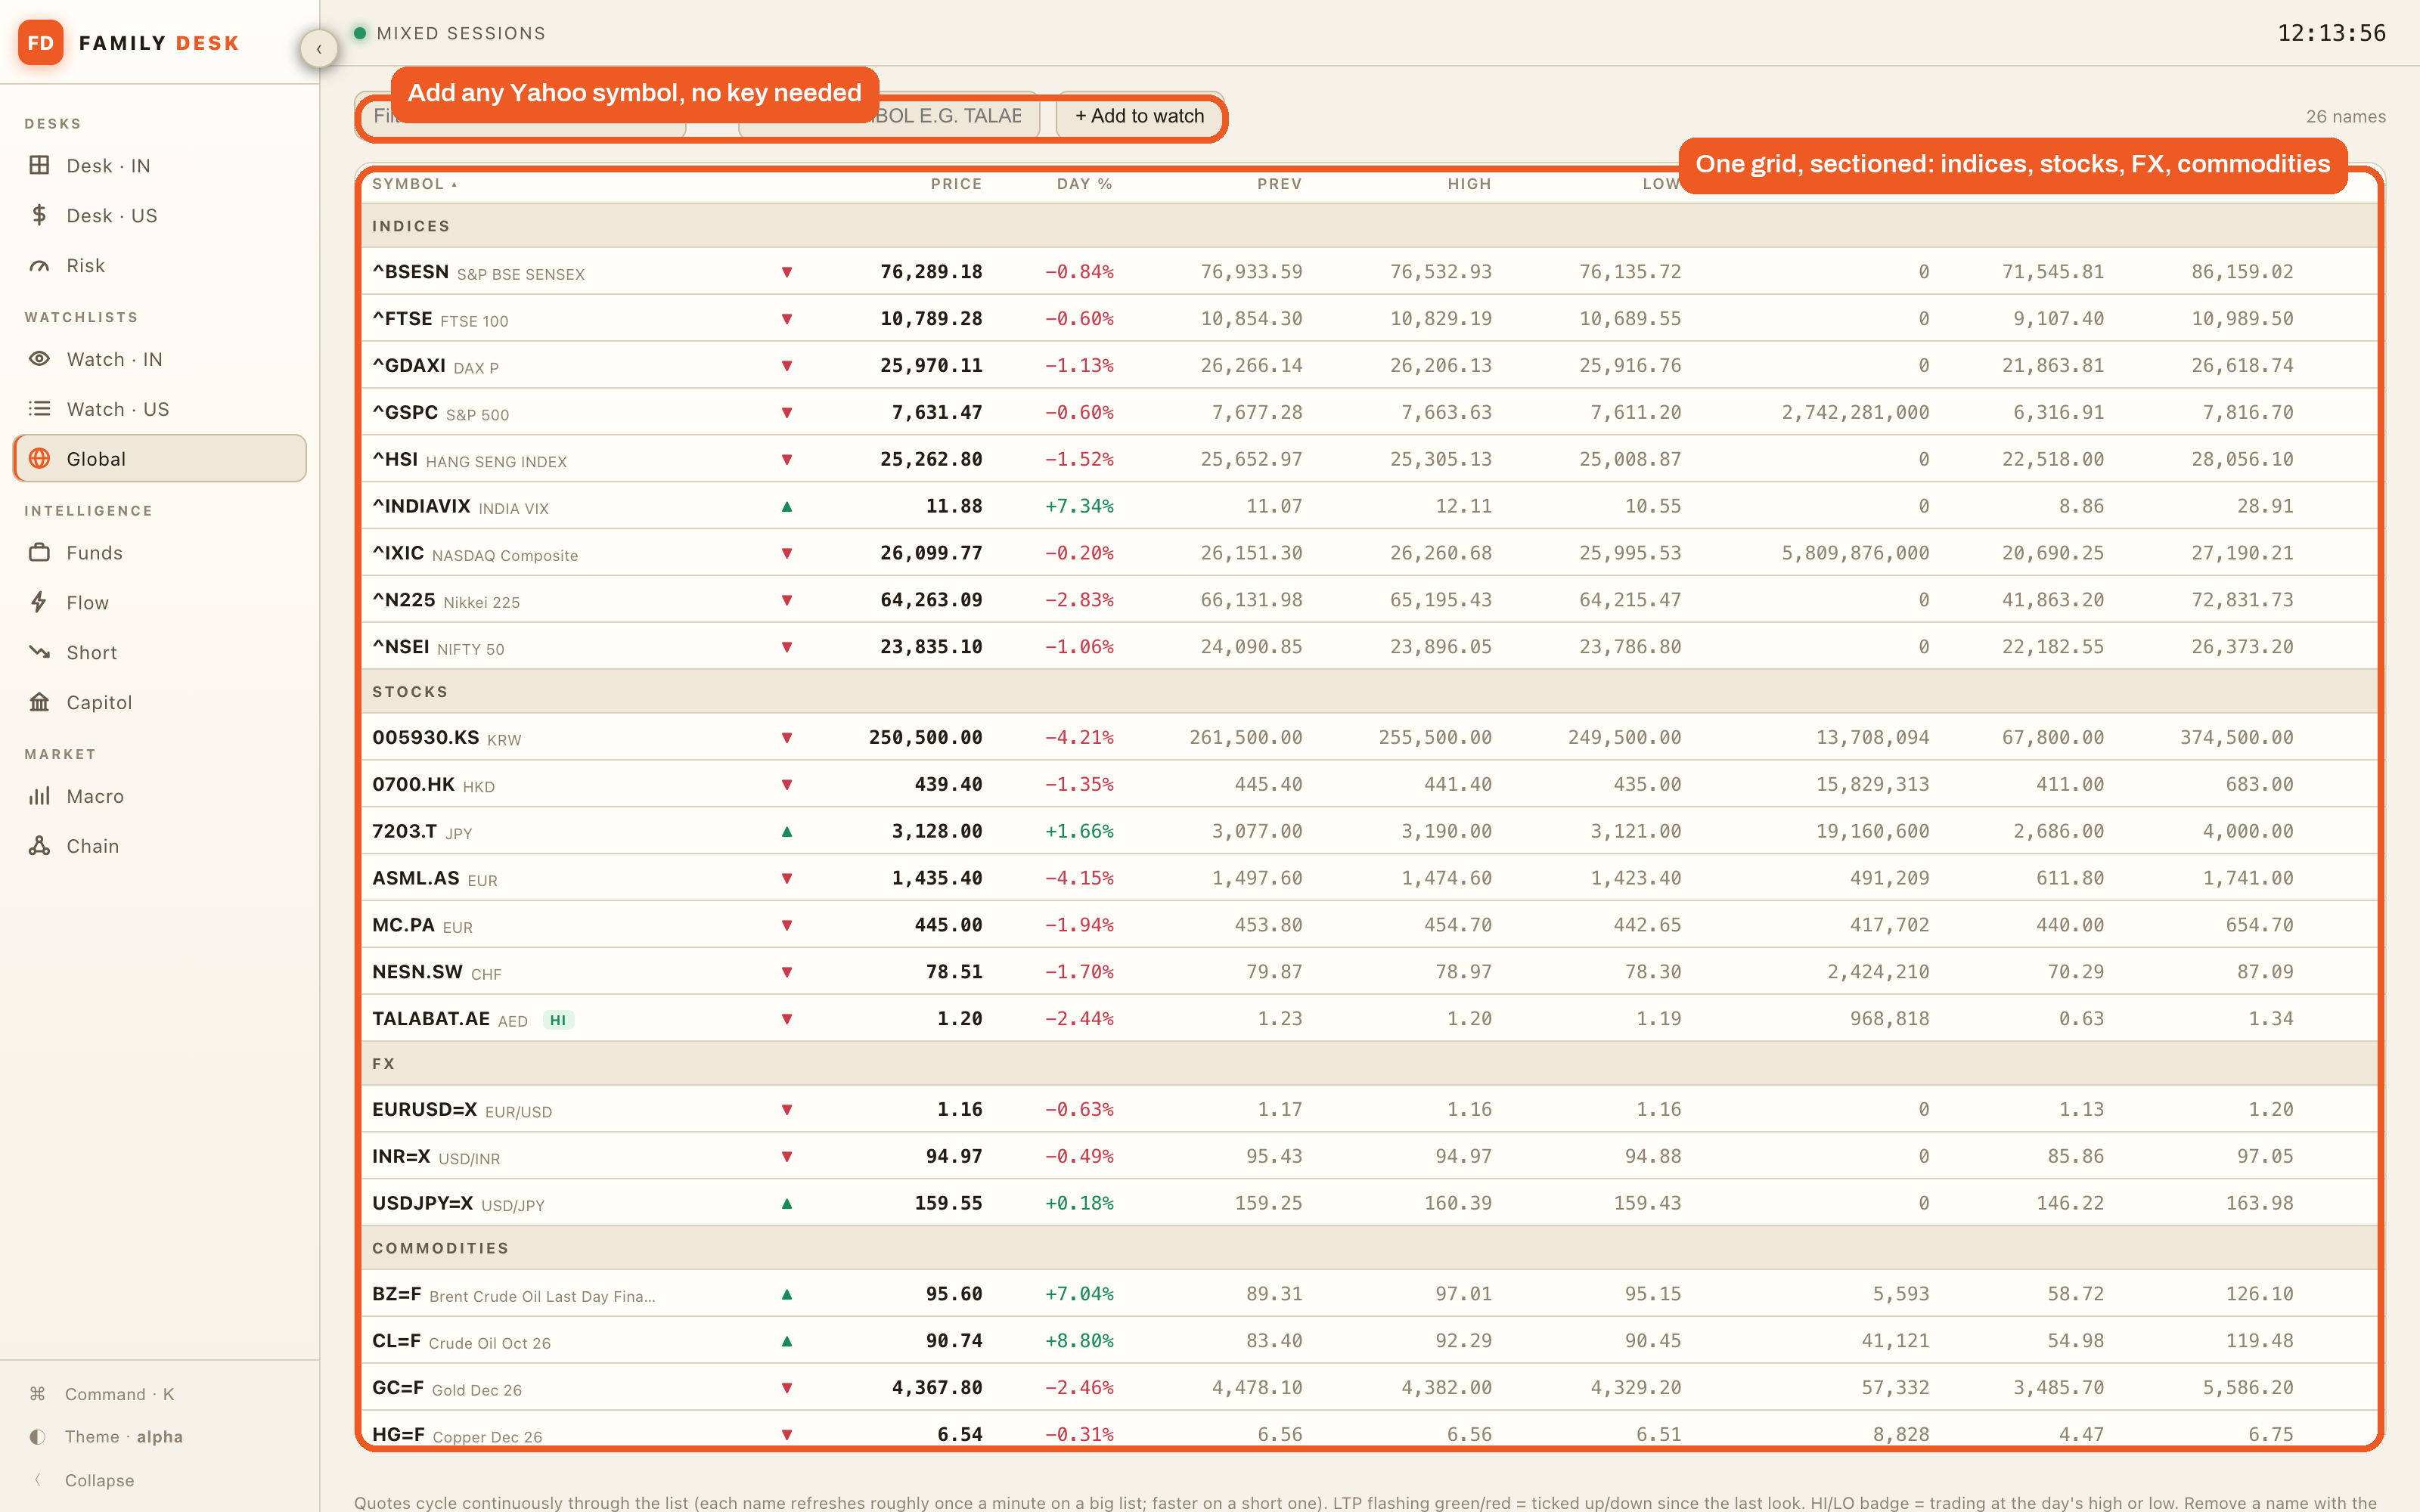
Watch·IN reads the broker with live ticks, Watch·US reads the feed, and Global reads Yahoo’s free quotes with no key at all, which is how one grid holds indices, stocks from seven exchanges, the currency pairs and the commodities. The quotes cycle through each list about once a minute, the price flashes when it ticks, and a badge comes up when a name is at the day’s high or low. You add a name by typing its symbol at the top, and each list is one small file of symbols, so adding a market is adding a line to it.
The intelligence tabs read the public record
The other three intelligence tabs work the way Funds does, a public dataset read on a schedule and shown for the names I own or watch.
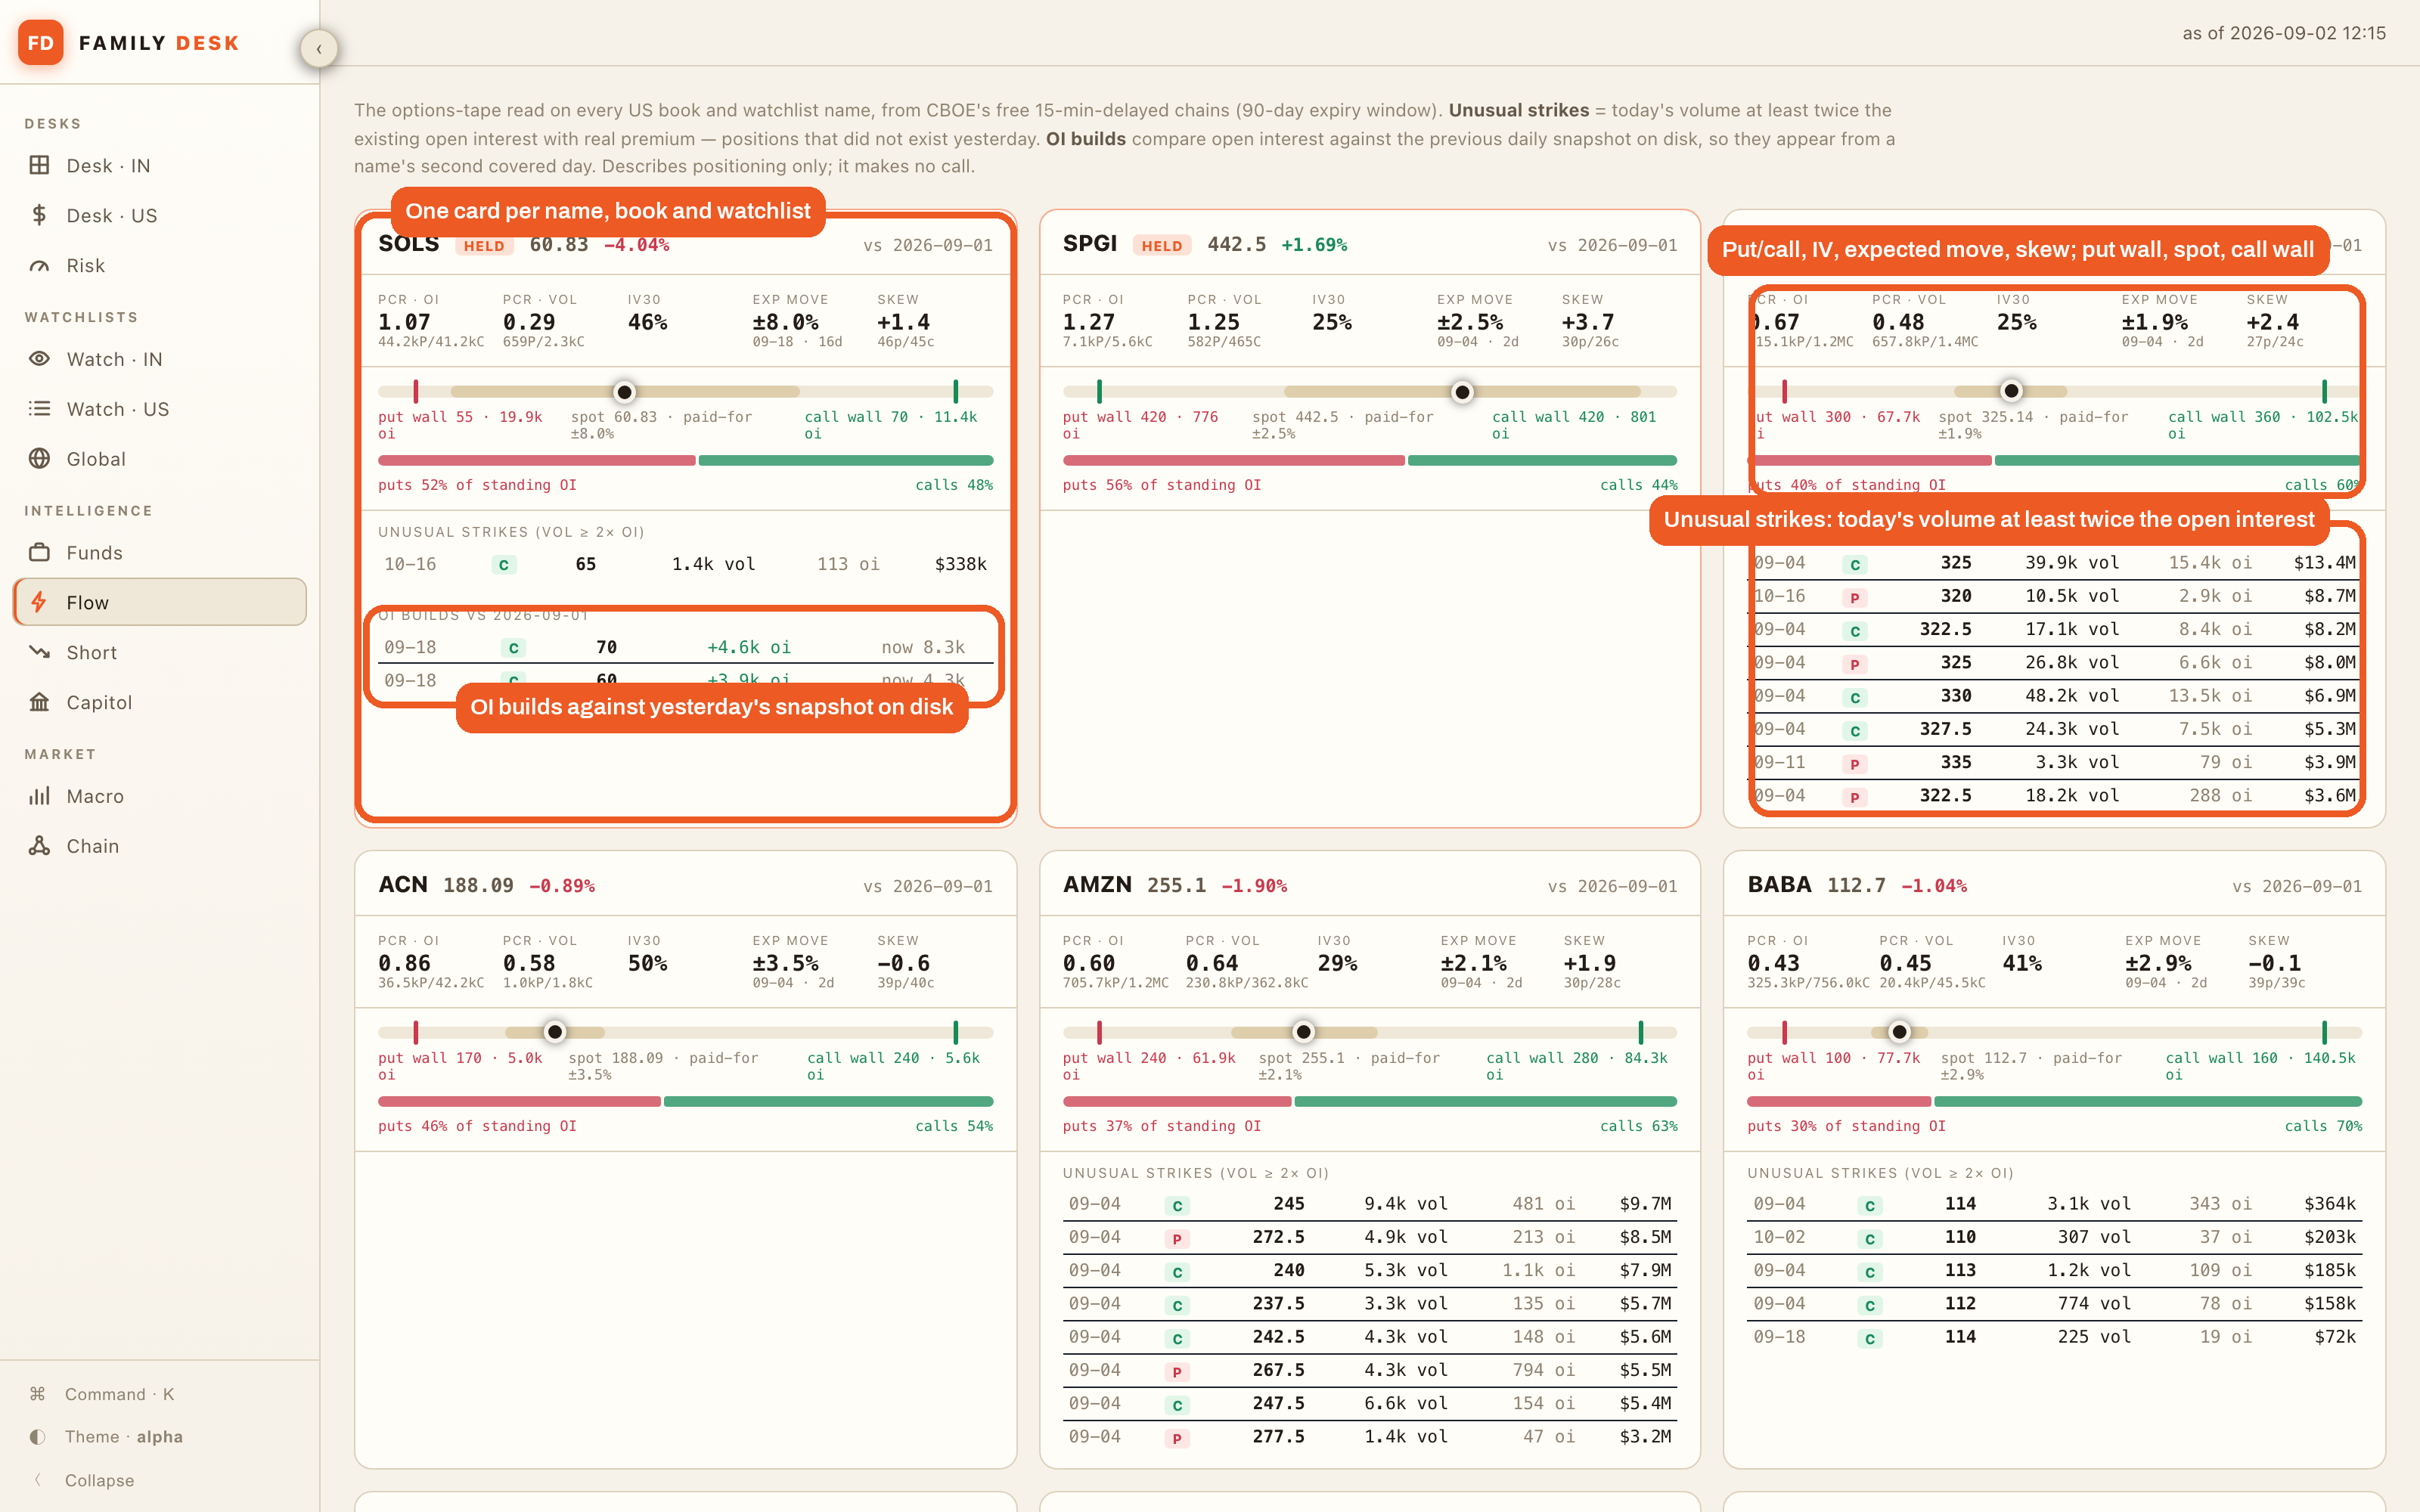
Flow reads the options chain, the full list of puts and calls trading on a name, for every US name on the book and the watchlist, from the options exchange’s free delayed data at CBOE, and shows what the tape is positioned for, where the puts and the calls are stacked, and which strikes saw a position appear today that did not exist yesterday, against a snapshot the tab saves for itself every day, so I run nothing, I click the tab and it has already fetched the chains and worked out what changed since yesterday. It describes positioning and it makes no call, and I do not make one from it either.
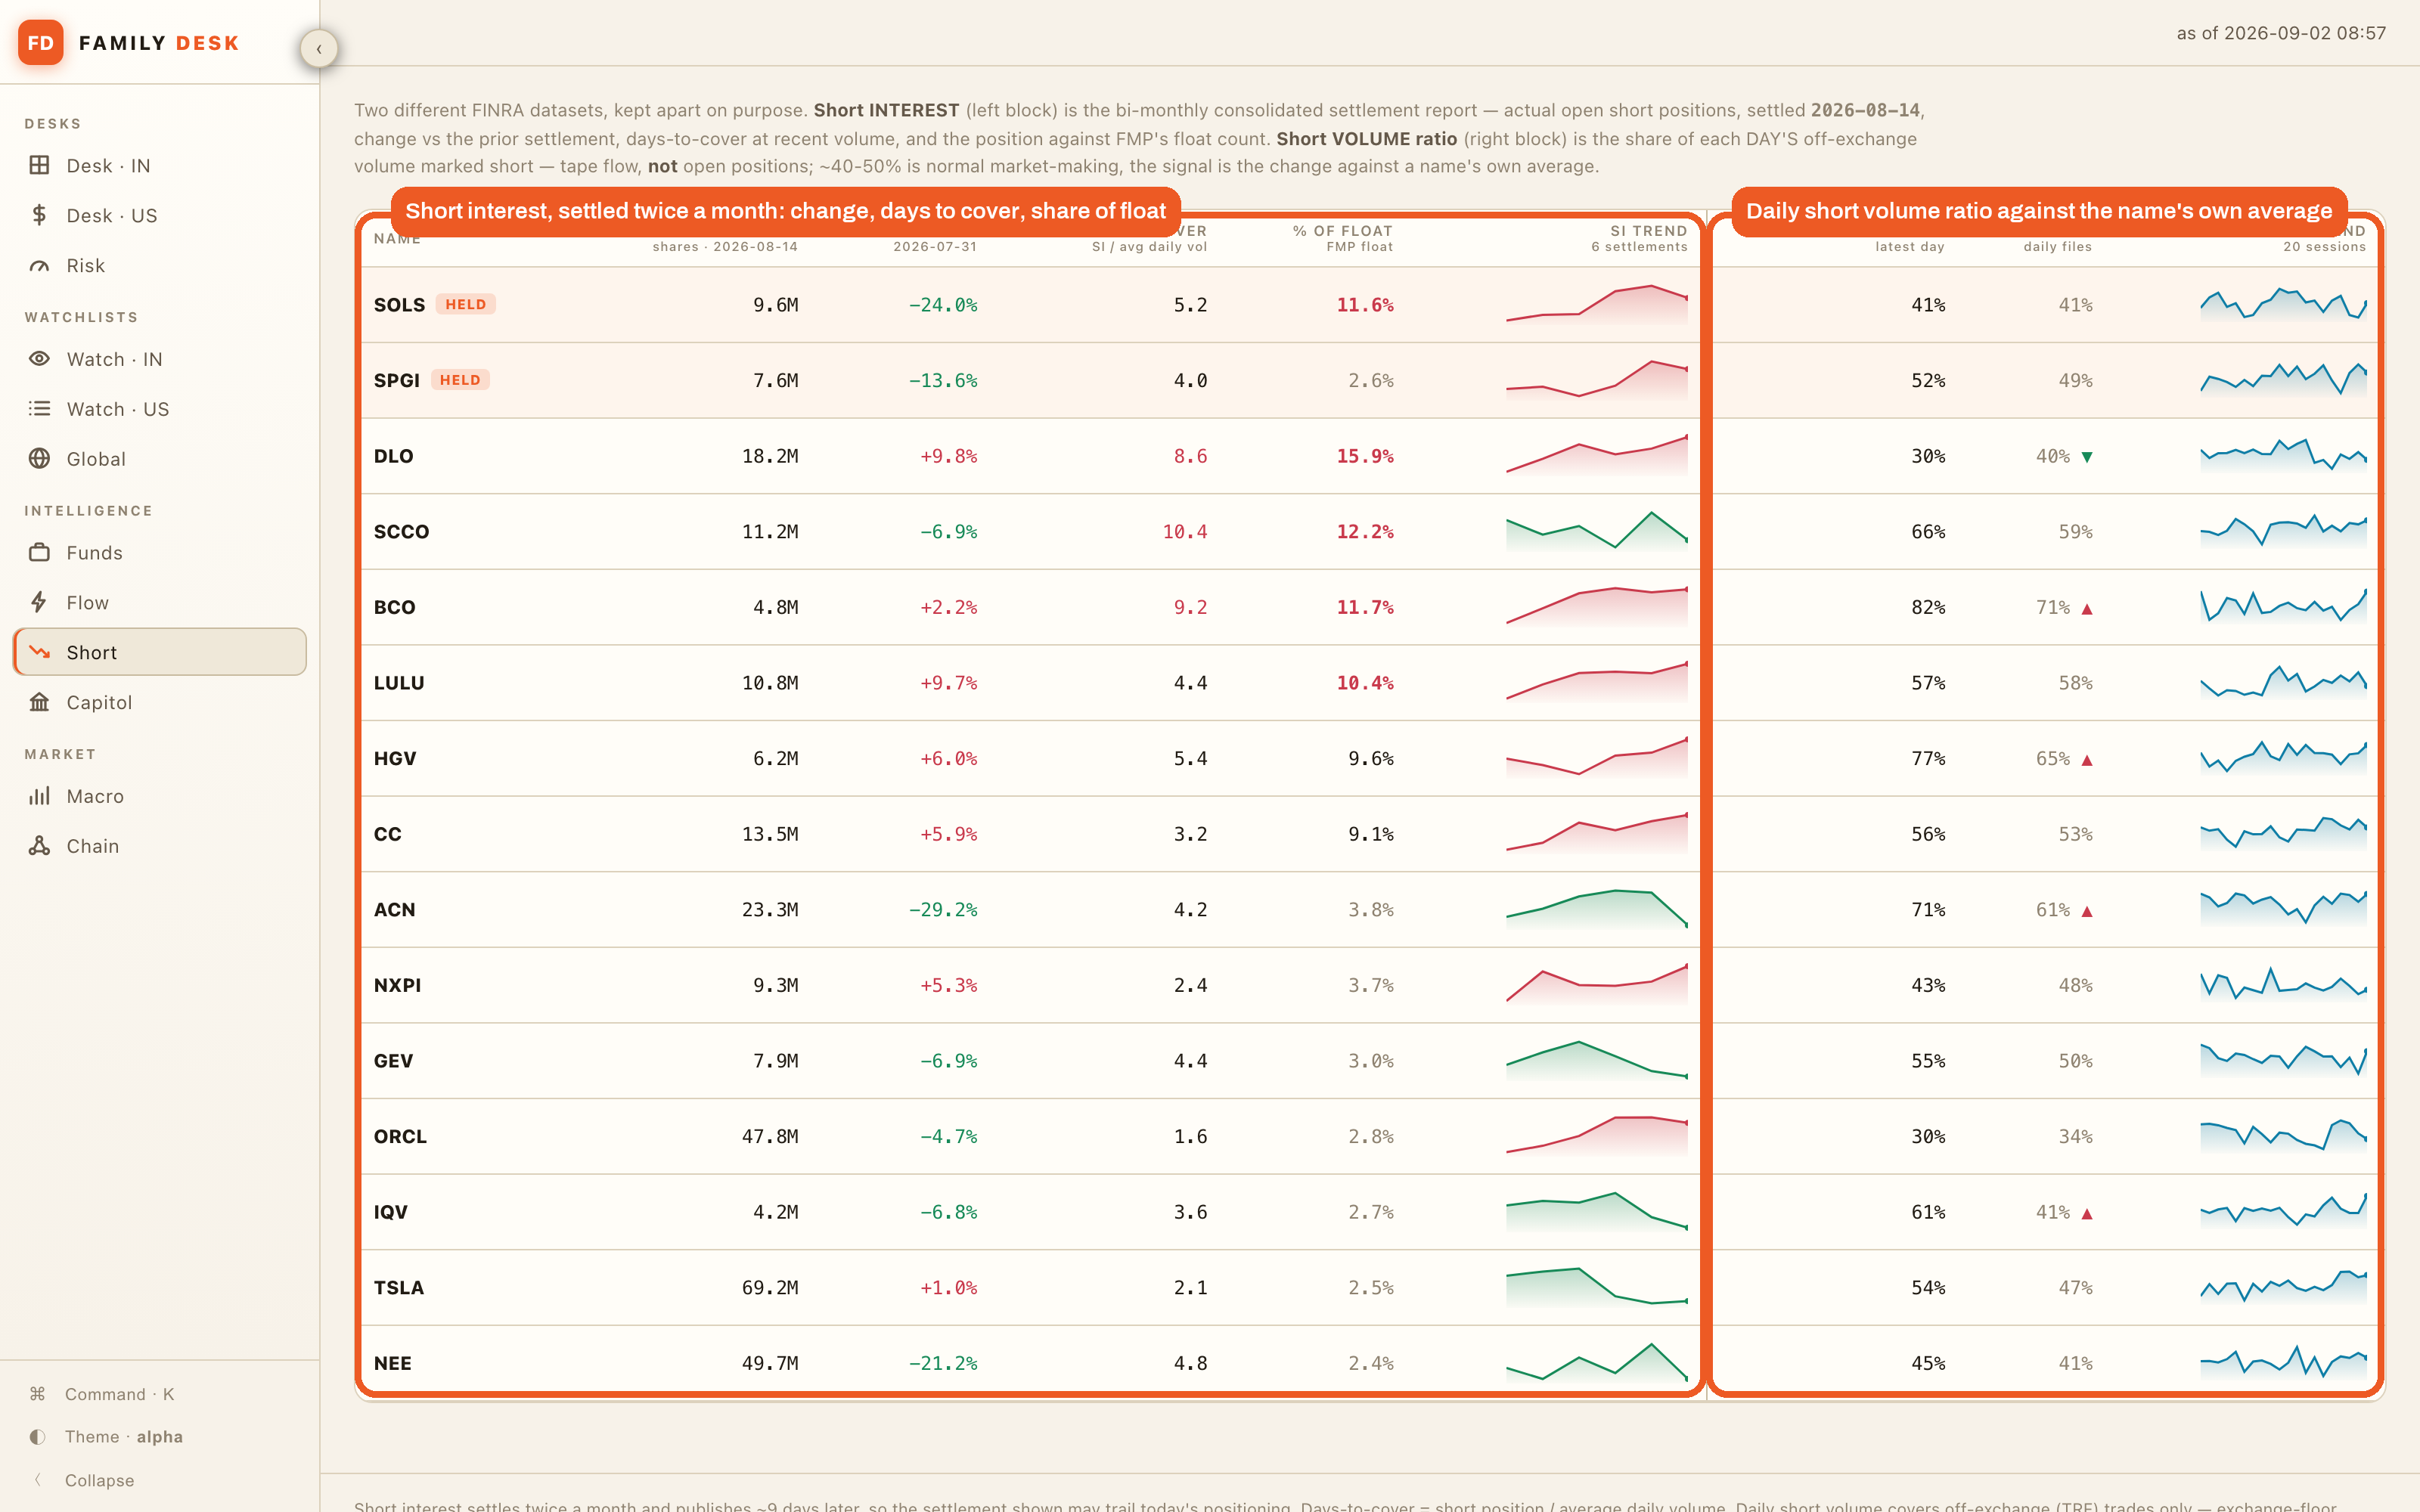
Short reads FINRA, the regulator that publishes the US short-selling data, and I keep its two datasets apart on purpose, because people mix them up. On the left is short interest, the actual open short position, settled twice a month. On the right is the daily short volume ratio, the share of each day’s volume marked short, where 40 to 50 percent is normal market-making and the only signal is the change against a name’s own average.
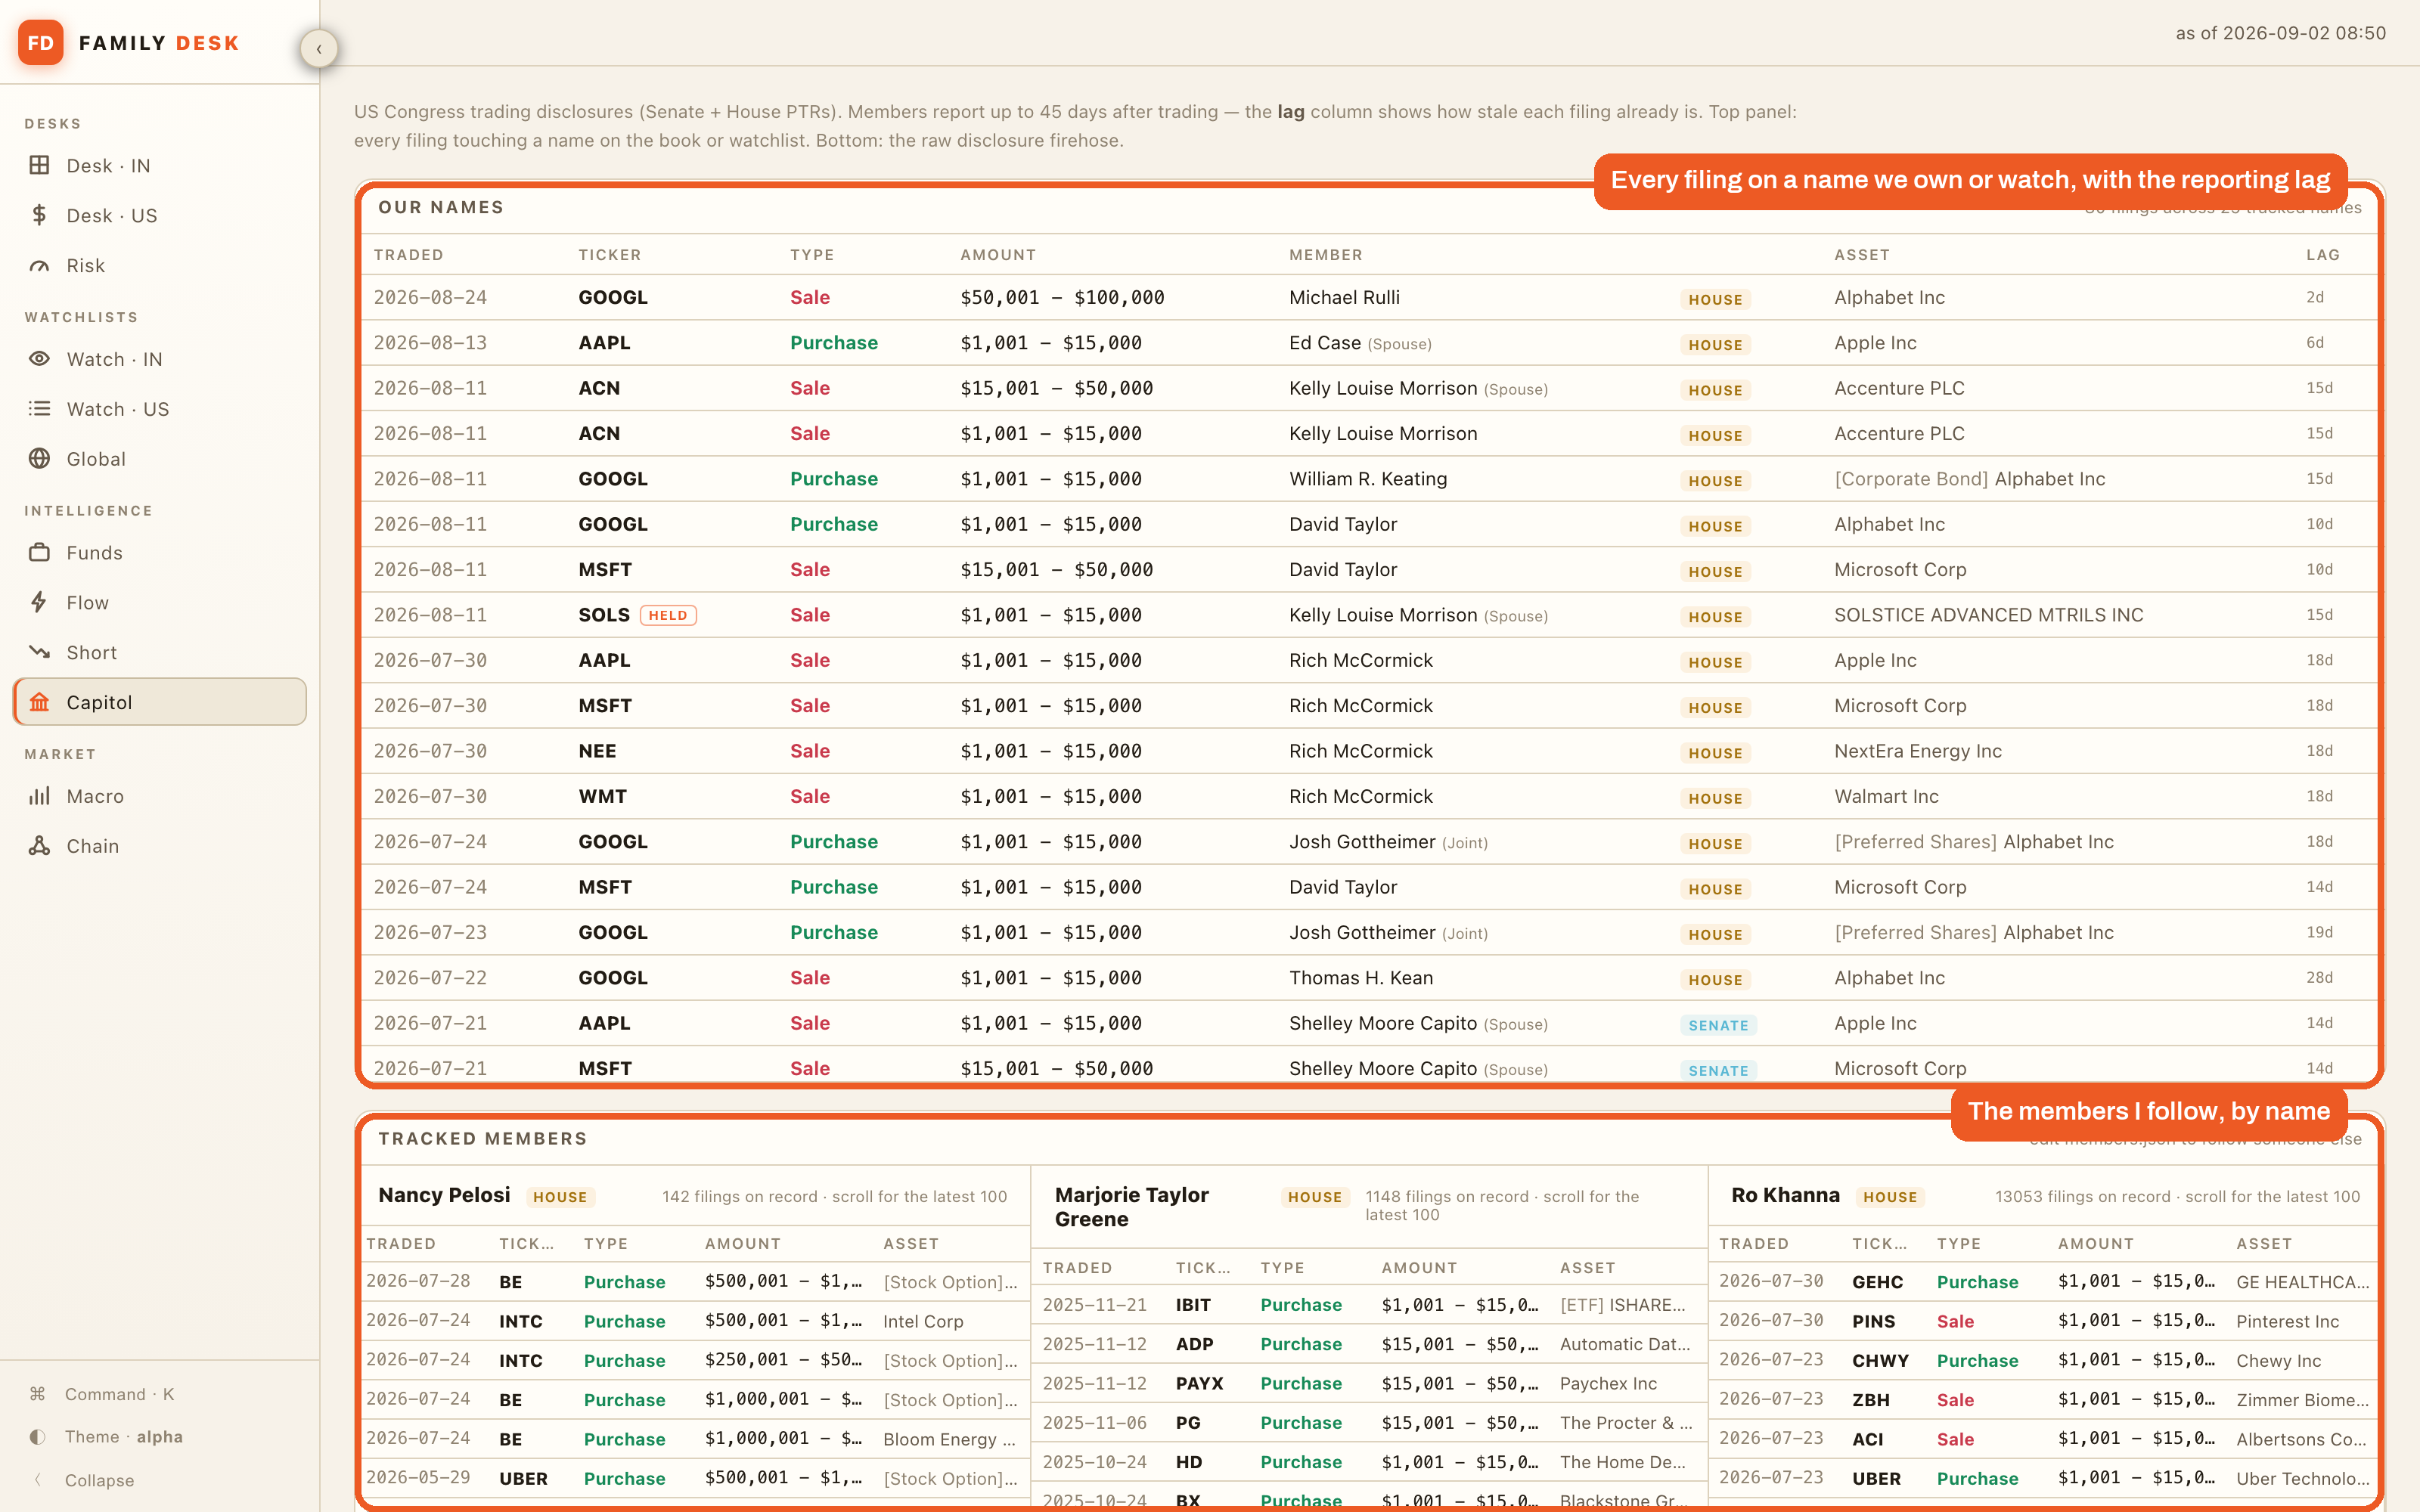
Capitol reads the trading disclosures that US senators and representatives have to file, filtered to the names on the book and the watchlist, with a lag column, because members get up to 45 days to report and the filing is old by the time you see it. Under it sit the members I track by name, and who to track is one small file.
Macro and Chain, the backdrop
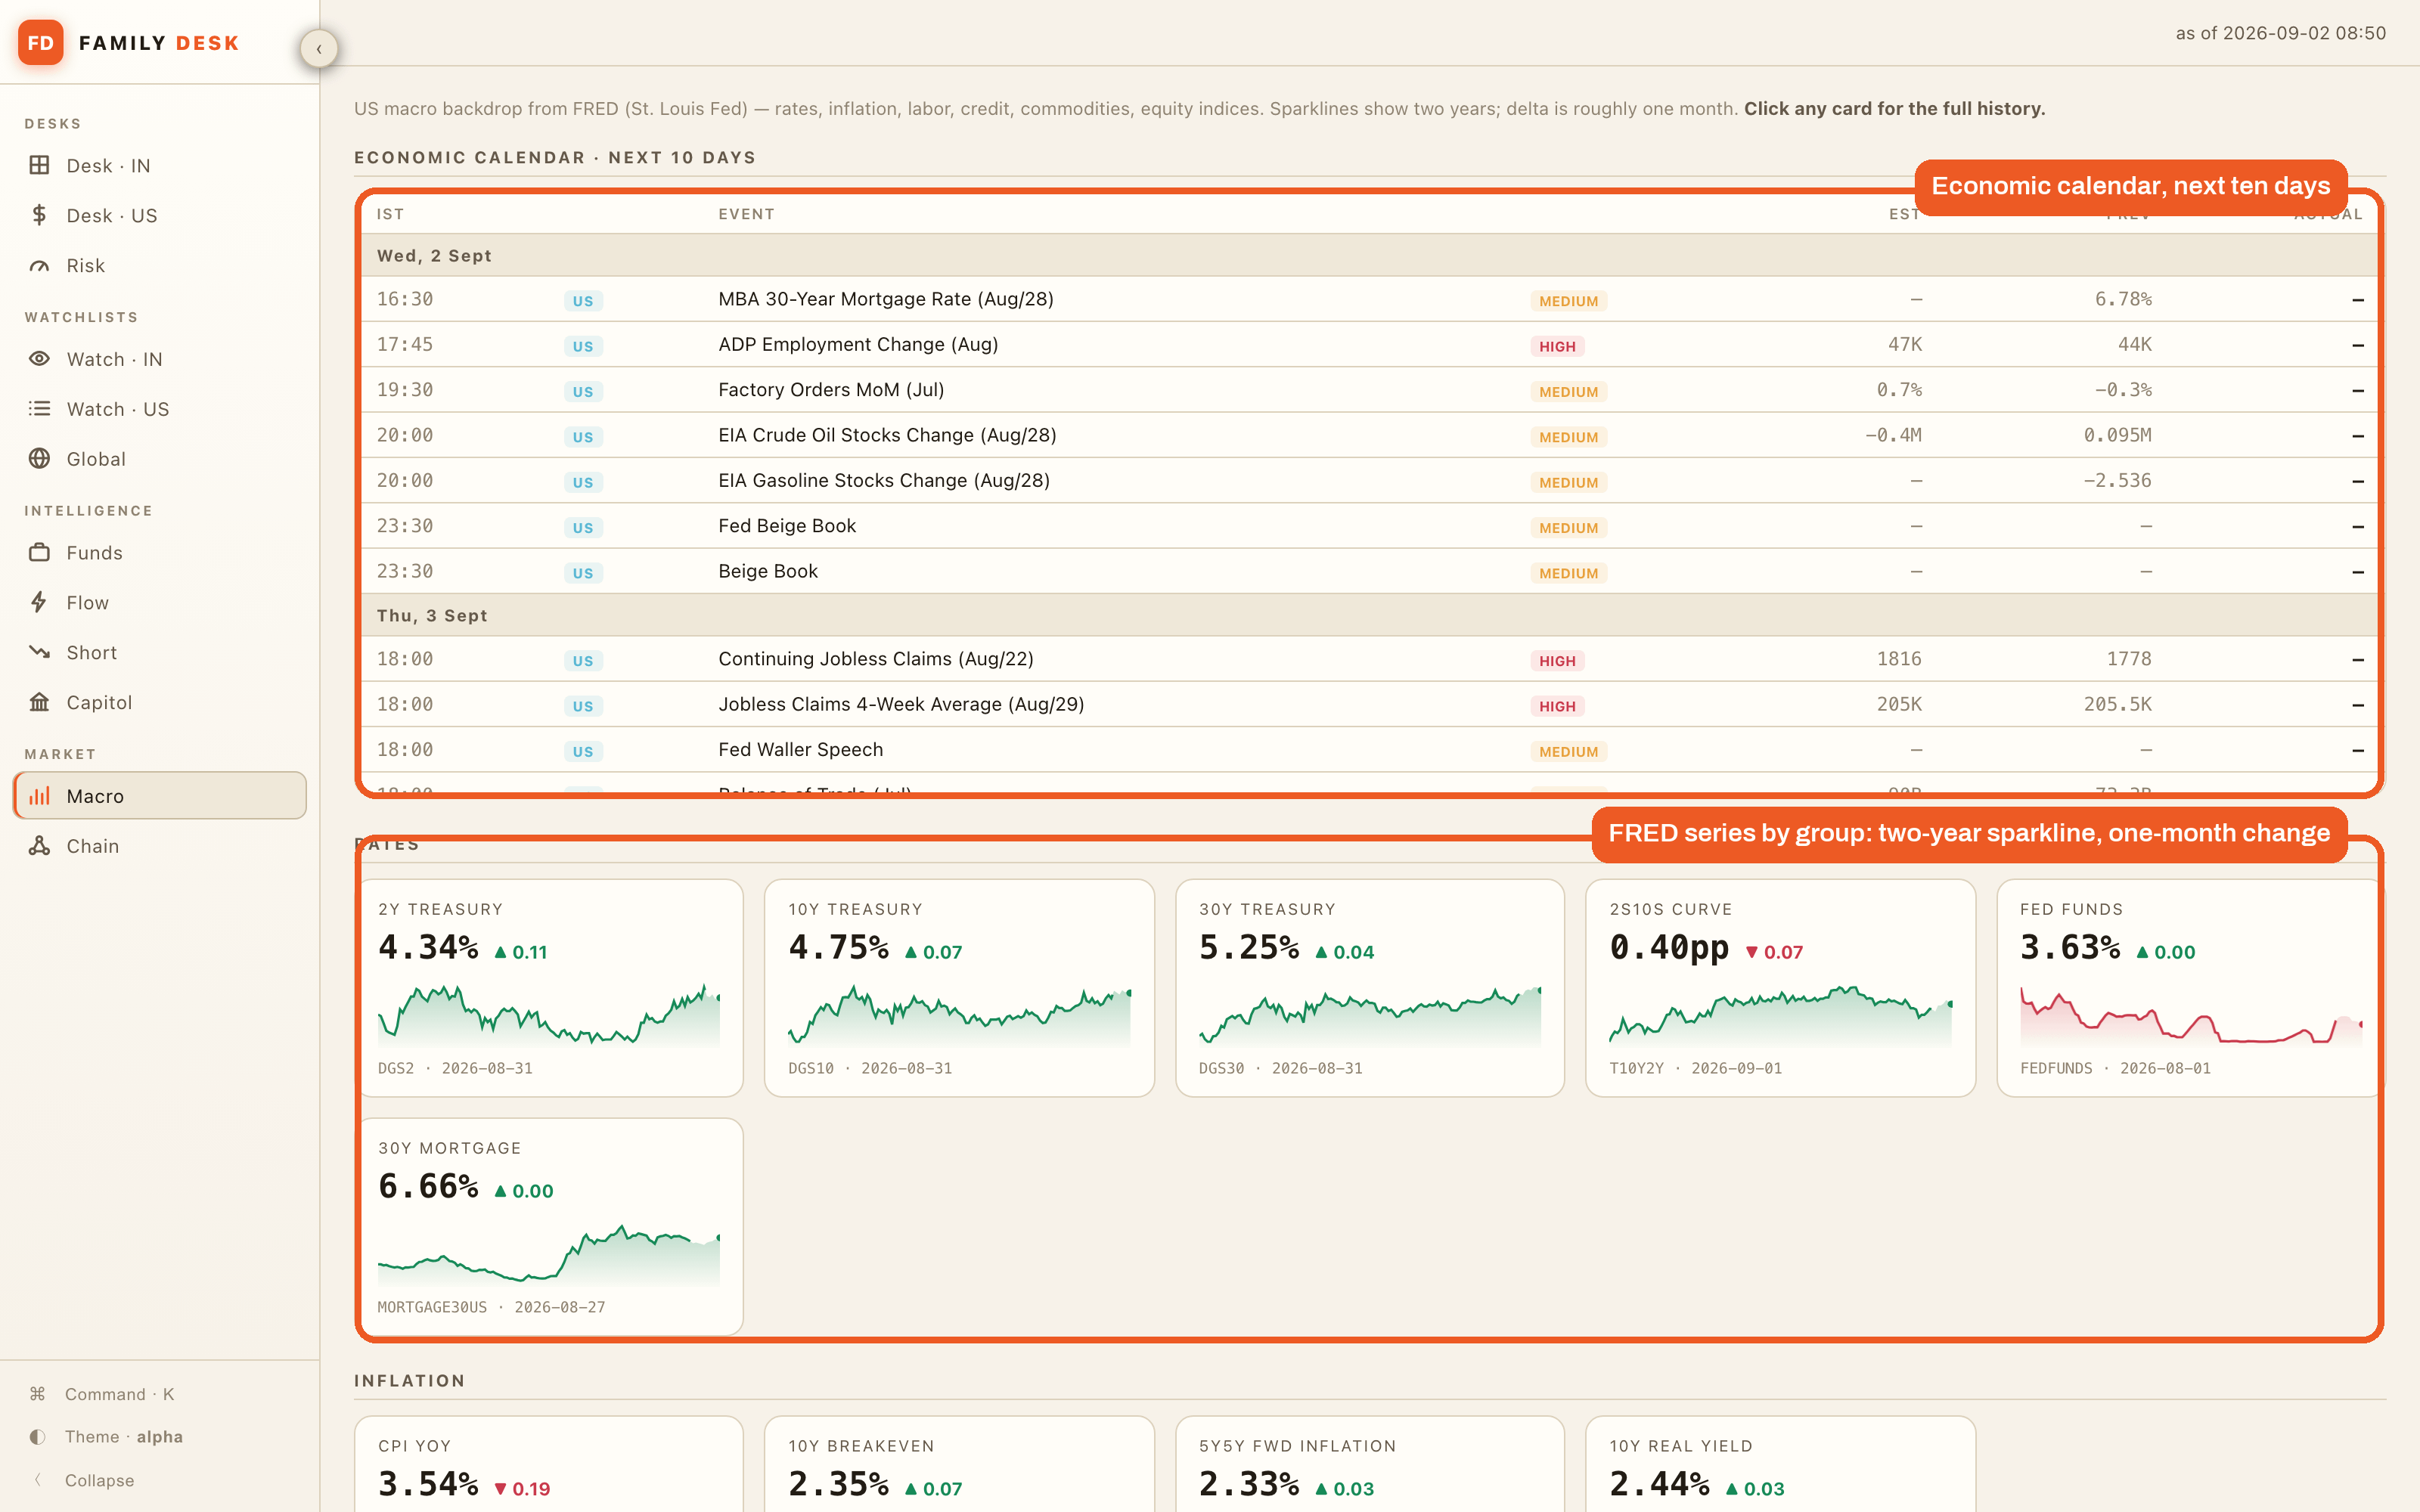
Macro is 23 series from FRED, the St. Louis Fed’s free database, each one a card with a small two-year chart, and the economic calendar for the next ten days above them.
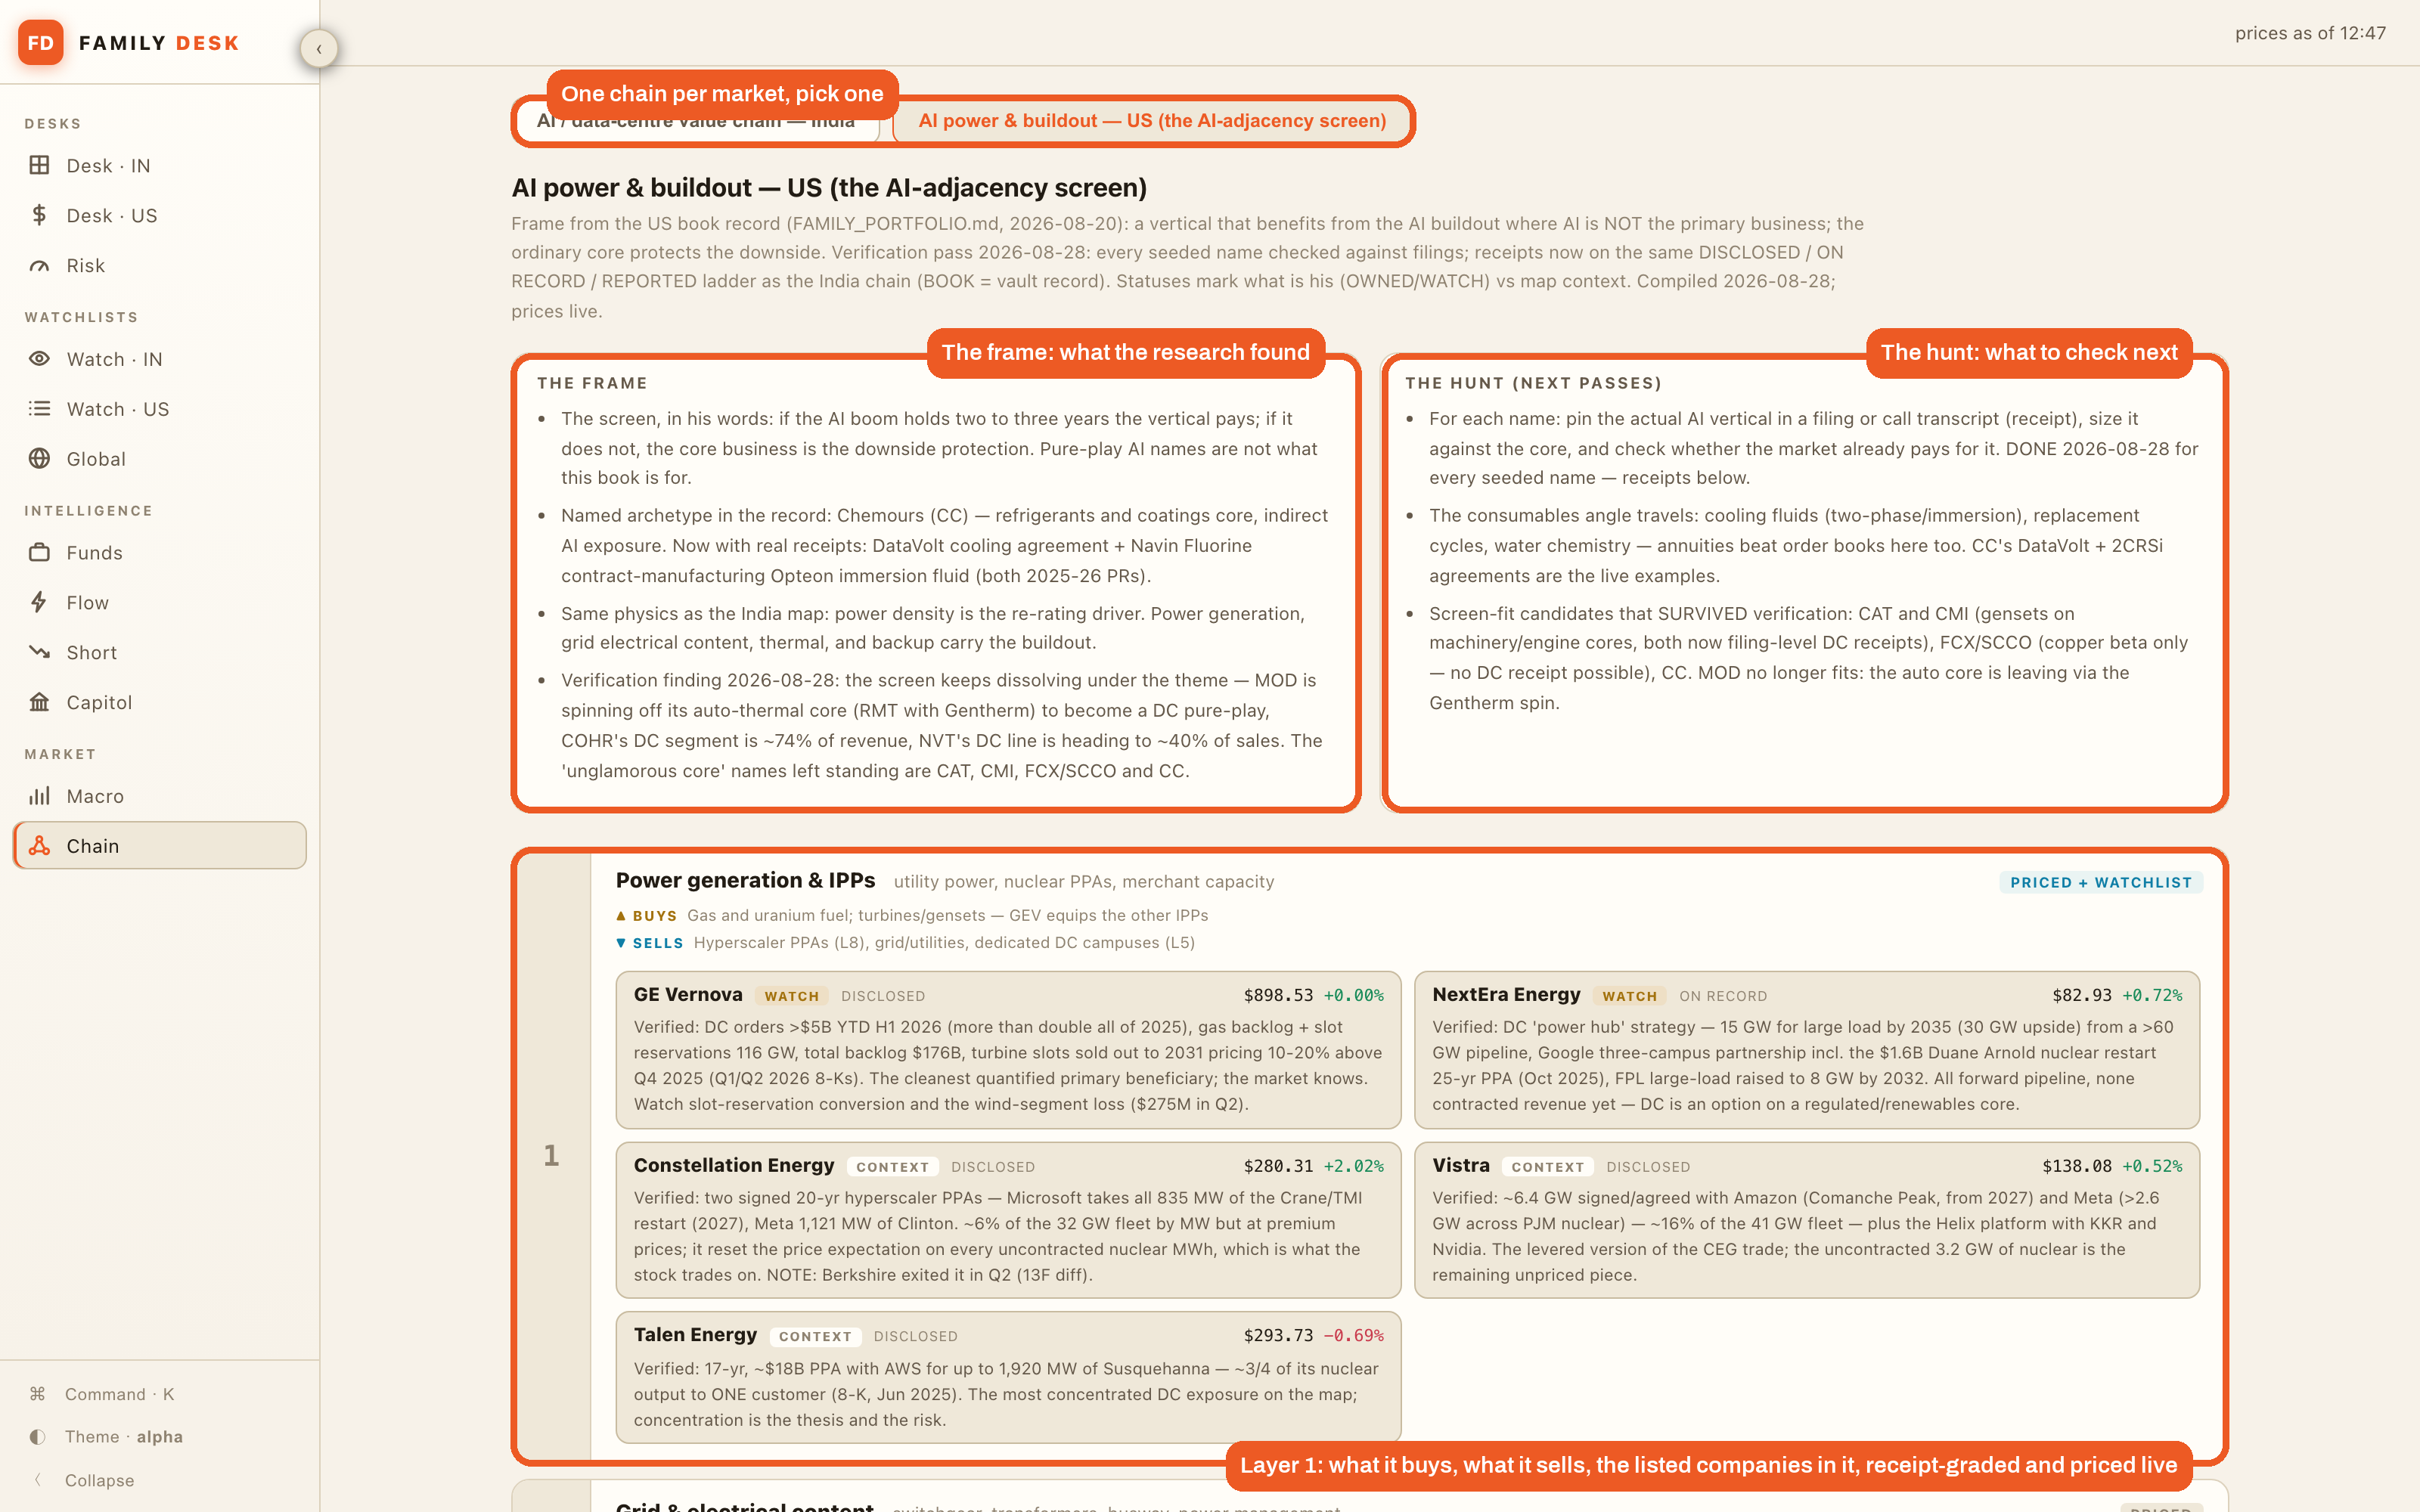
Chain is the supply chain map, and this one started as an edition. Bloomberg has a function that draws a company’s suppliers and customers, and in July I taught the agent to draw the same map from the filings alone, which is I Taught Claude Code to Draw a Bloomberg-Style Supply Chain Map from SEC Filings if you want the method, so on the desk it was one instruction: take the value chain I am interested in, lay it out layer by layer, what each layer buys and what it sells, put the listed companies under each layer, grade every link by whether the company disclosed it in a filing, said it on record, or it was only reported, and keep it priced. I am interested in the AI build-out, so mine are the AI chains for the two markets I trade, one screen each, and the frame and the hunt at the top are the research notes the map came out of. You can ask for any chain the same way, semiconductors end to end, backward and forward integration, whatever you are trying to understand, and the map comes out of the vault while the tab keeps it priced and in view.
So that is the floor, and every tab on it is there because I asked for it, which is what to take away, because you can build yours to your own requirement, whatever features you need, and it will look nothing like mine. What it looks like when you click into one company is next.
How the desk shows one company
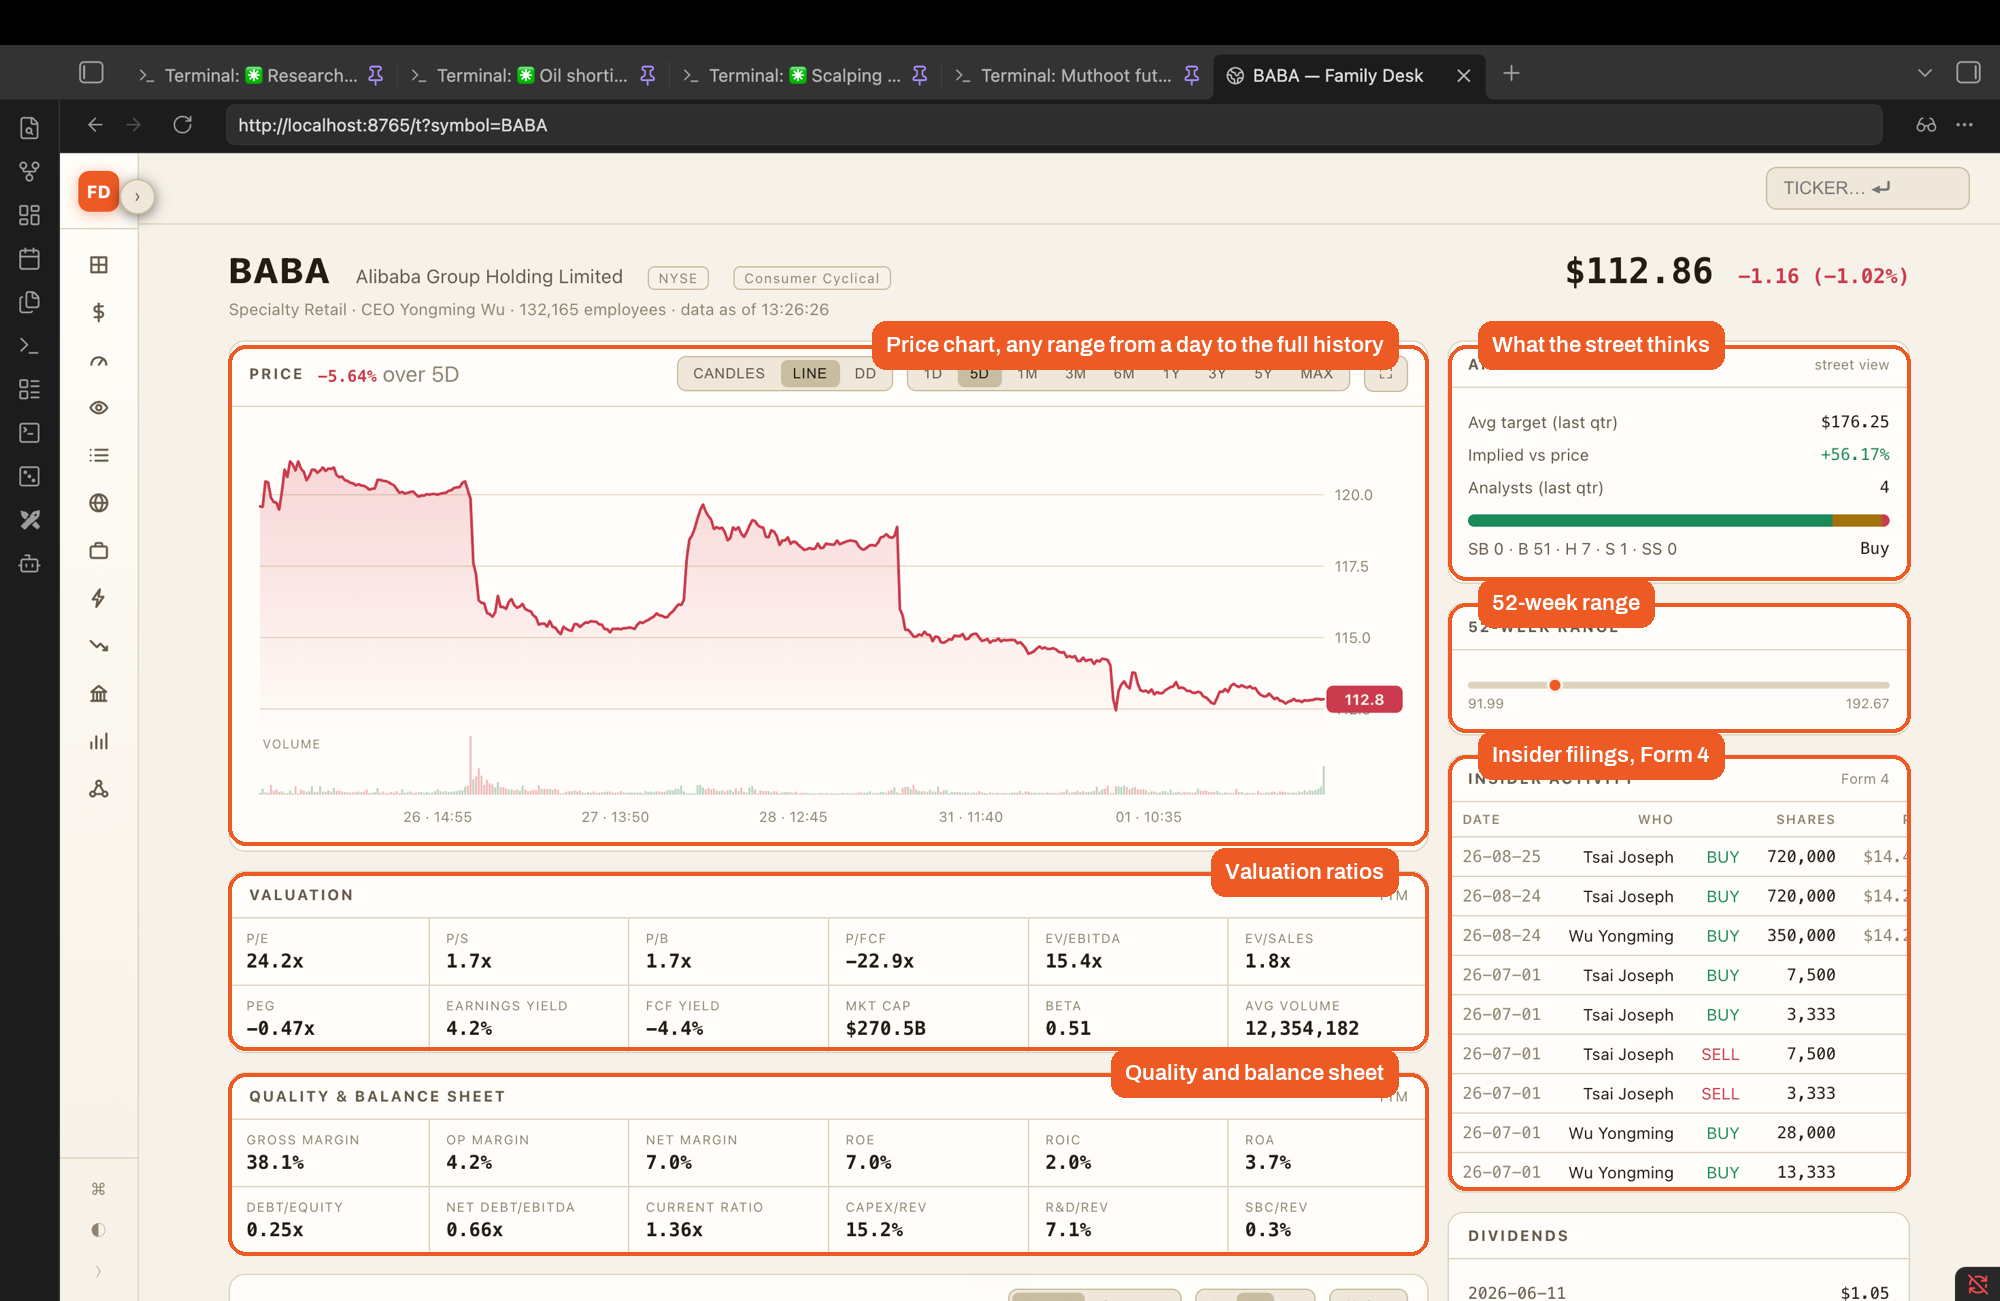
Cmd+K from anywhere on the desk takes a symbol, and what opens is the page I used to assemble from five or six sites every time I looked at a name. This one is Alibaba, because it was on the watchlist with a busy insider month, and the company is only the example here, so read the page, not the stock.
The top: the market’s view
A chart, the valuation ratios, the quality numbers, and down the right what the street thinks, where the price sits in its 52-week range, and what the insiders have been filing. That right-hand column is the part I used to open three different sites for.
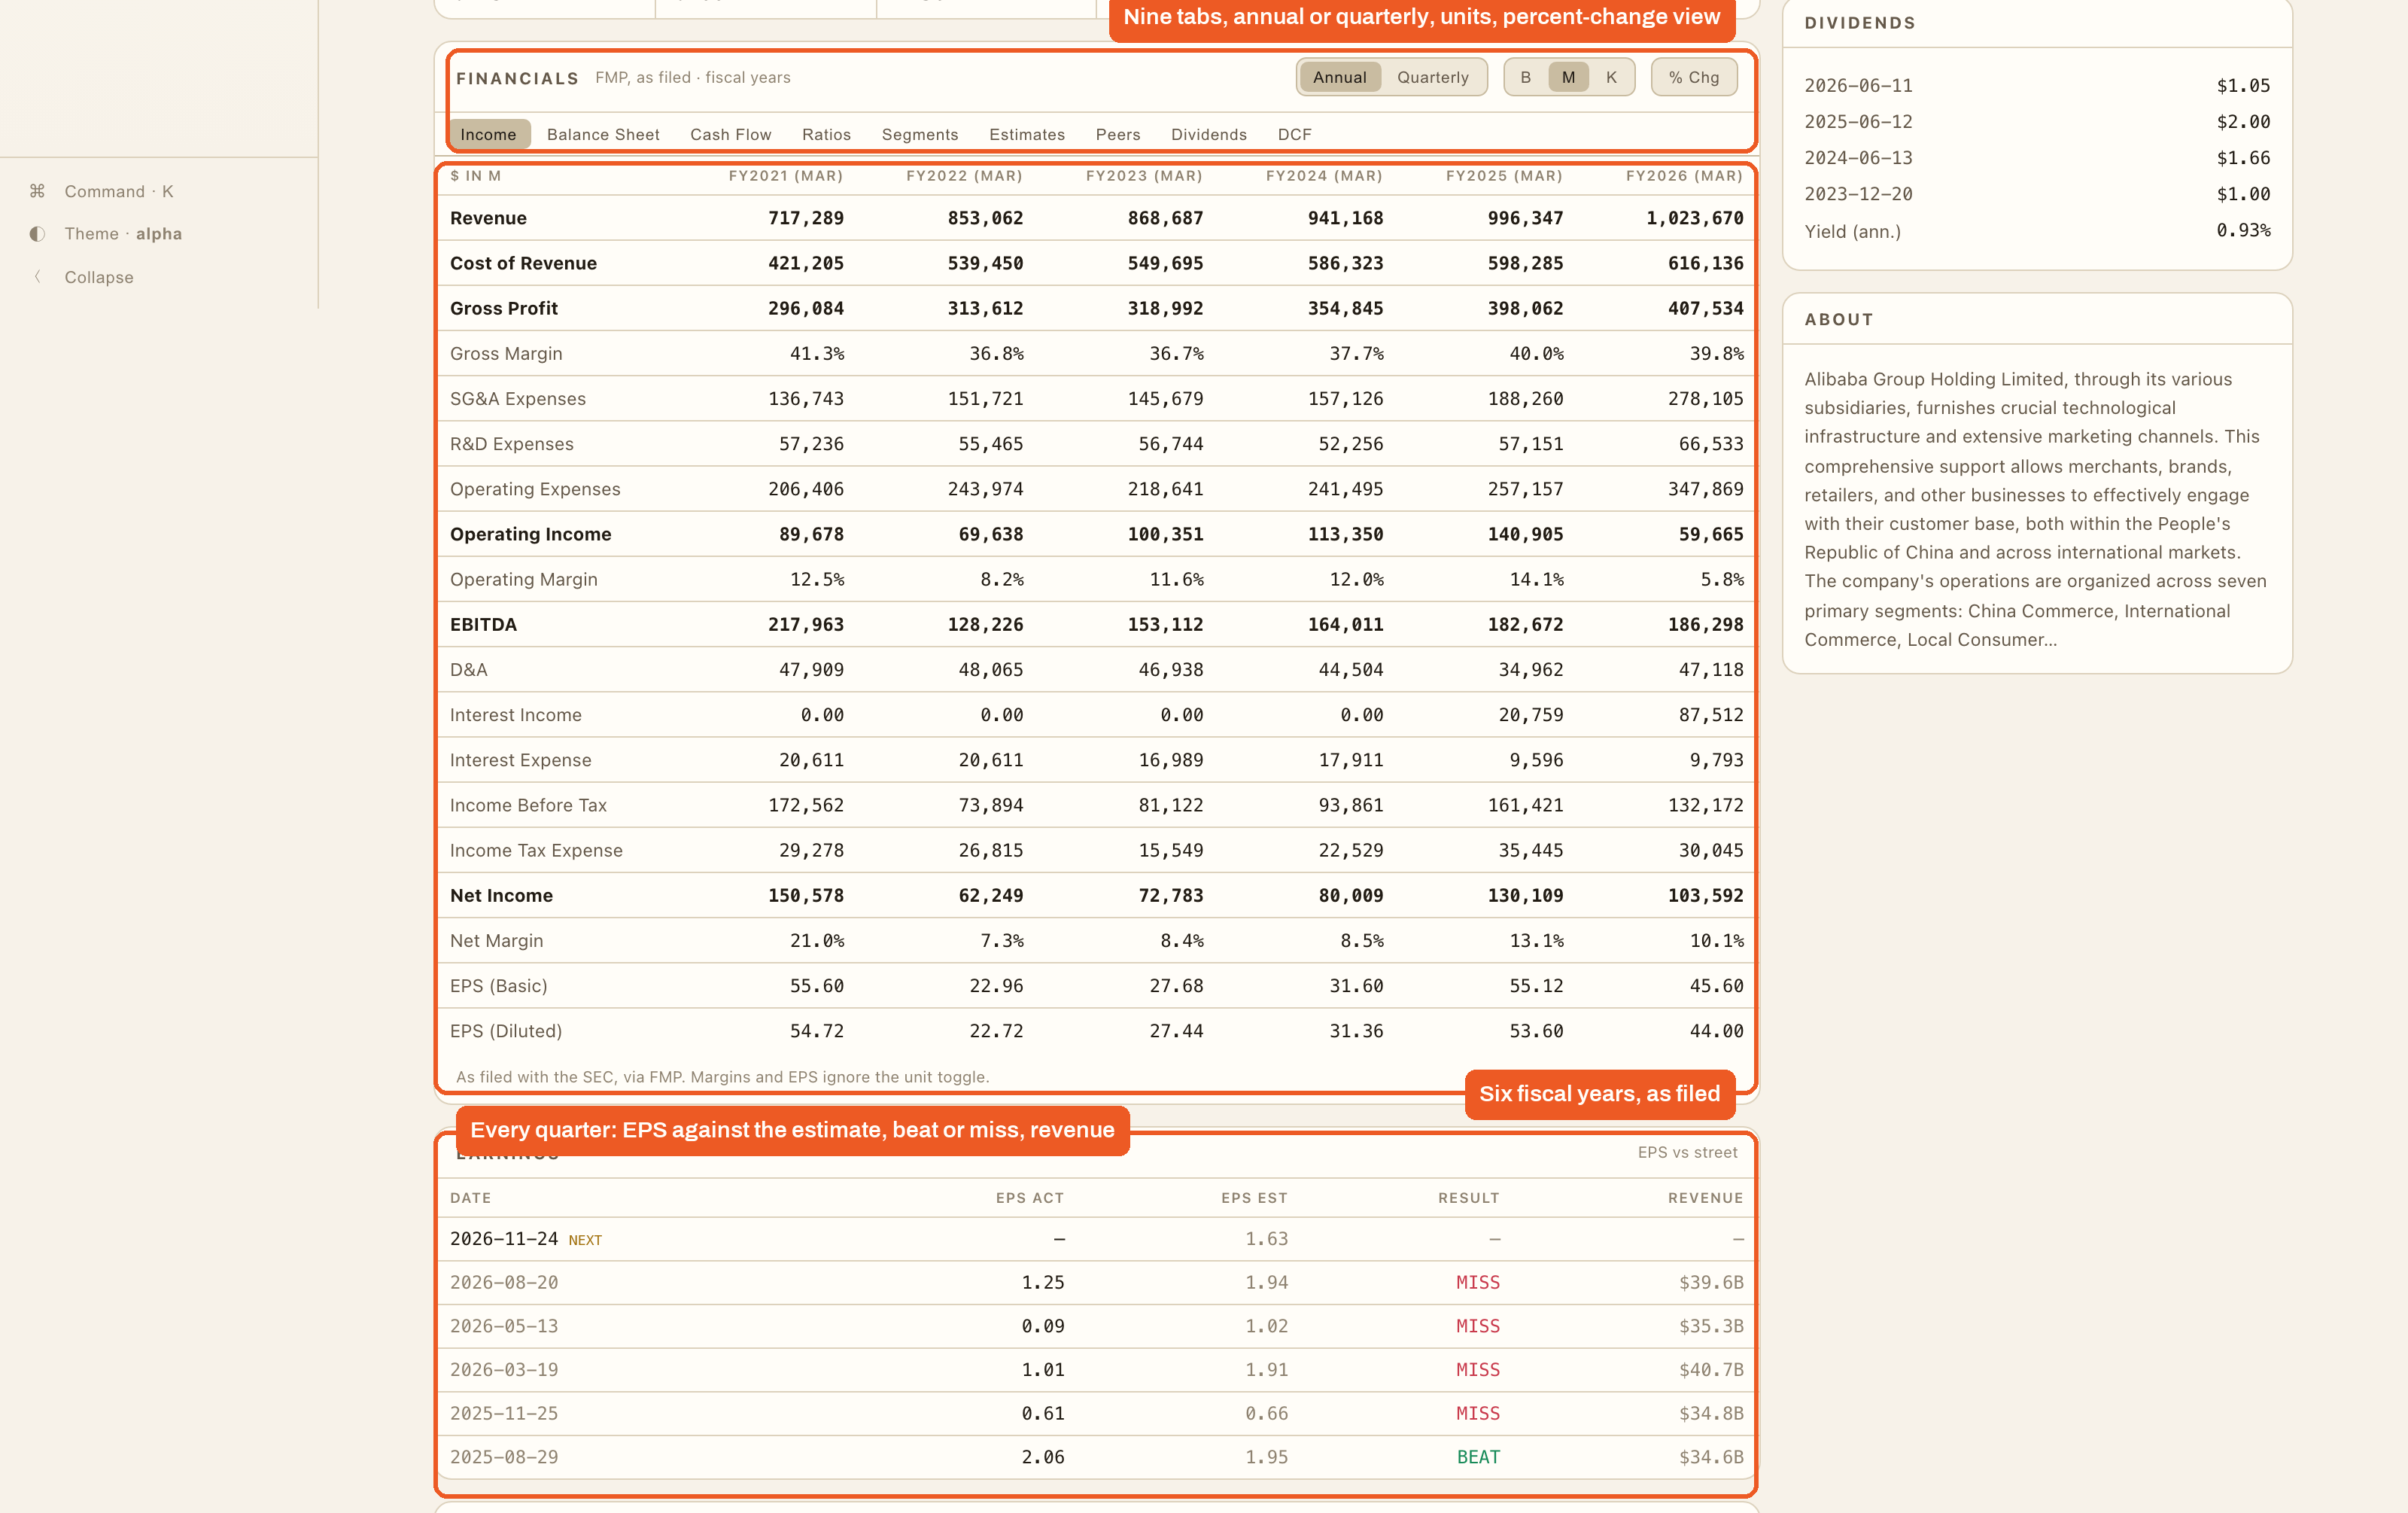
The middle: the filed numbers
The statements as filed, six years of them, income, balance sheet, cash flow, with the ratios, the segments, the estimates and the peers on their own tabs, and the earnings record underneath, every quarter against the estimate. I read the percent-change view first, because the shape of the change tells you where to look before any level does. This block is the one part of the desk that needs the paid feed, the statements, the peer set, the estimates and the seeds for the sandbox all come from it, and if you skip the feed this block stays empty and the agent pulls the same statements from the filings when you ask, the way the S&P Global run did, slower and one company at a time.
The bottom: a valuation sandbox
A discounted cash flow model, which is the standard way of turning a company’s future cash into a value today, with seven sliders, each one starting at the number the company actually filed, a fair value that moves as you drag, and a reset button that puts everything back. It answers one question, what am I assuming at this price, and never what anyone should do, and that is why it lives on the page and not in a spreadsheet, because the assumptions sit in front of you every time you look at a company and you cannot skip past them.
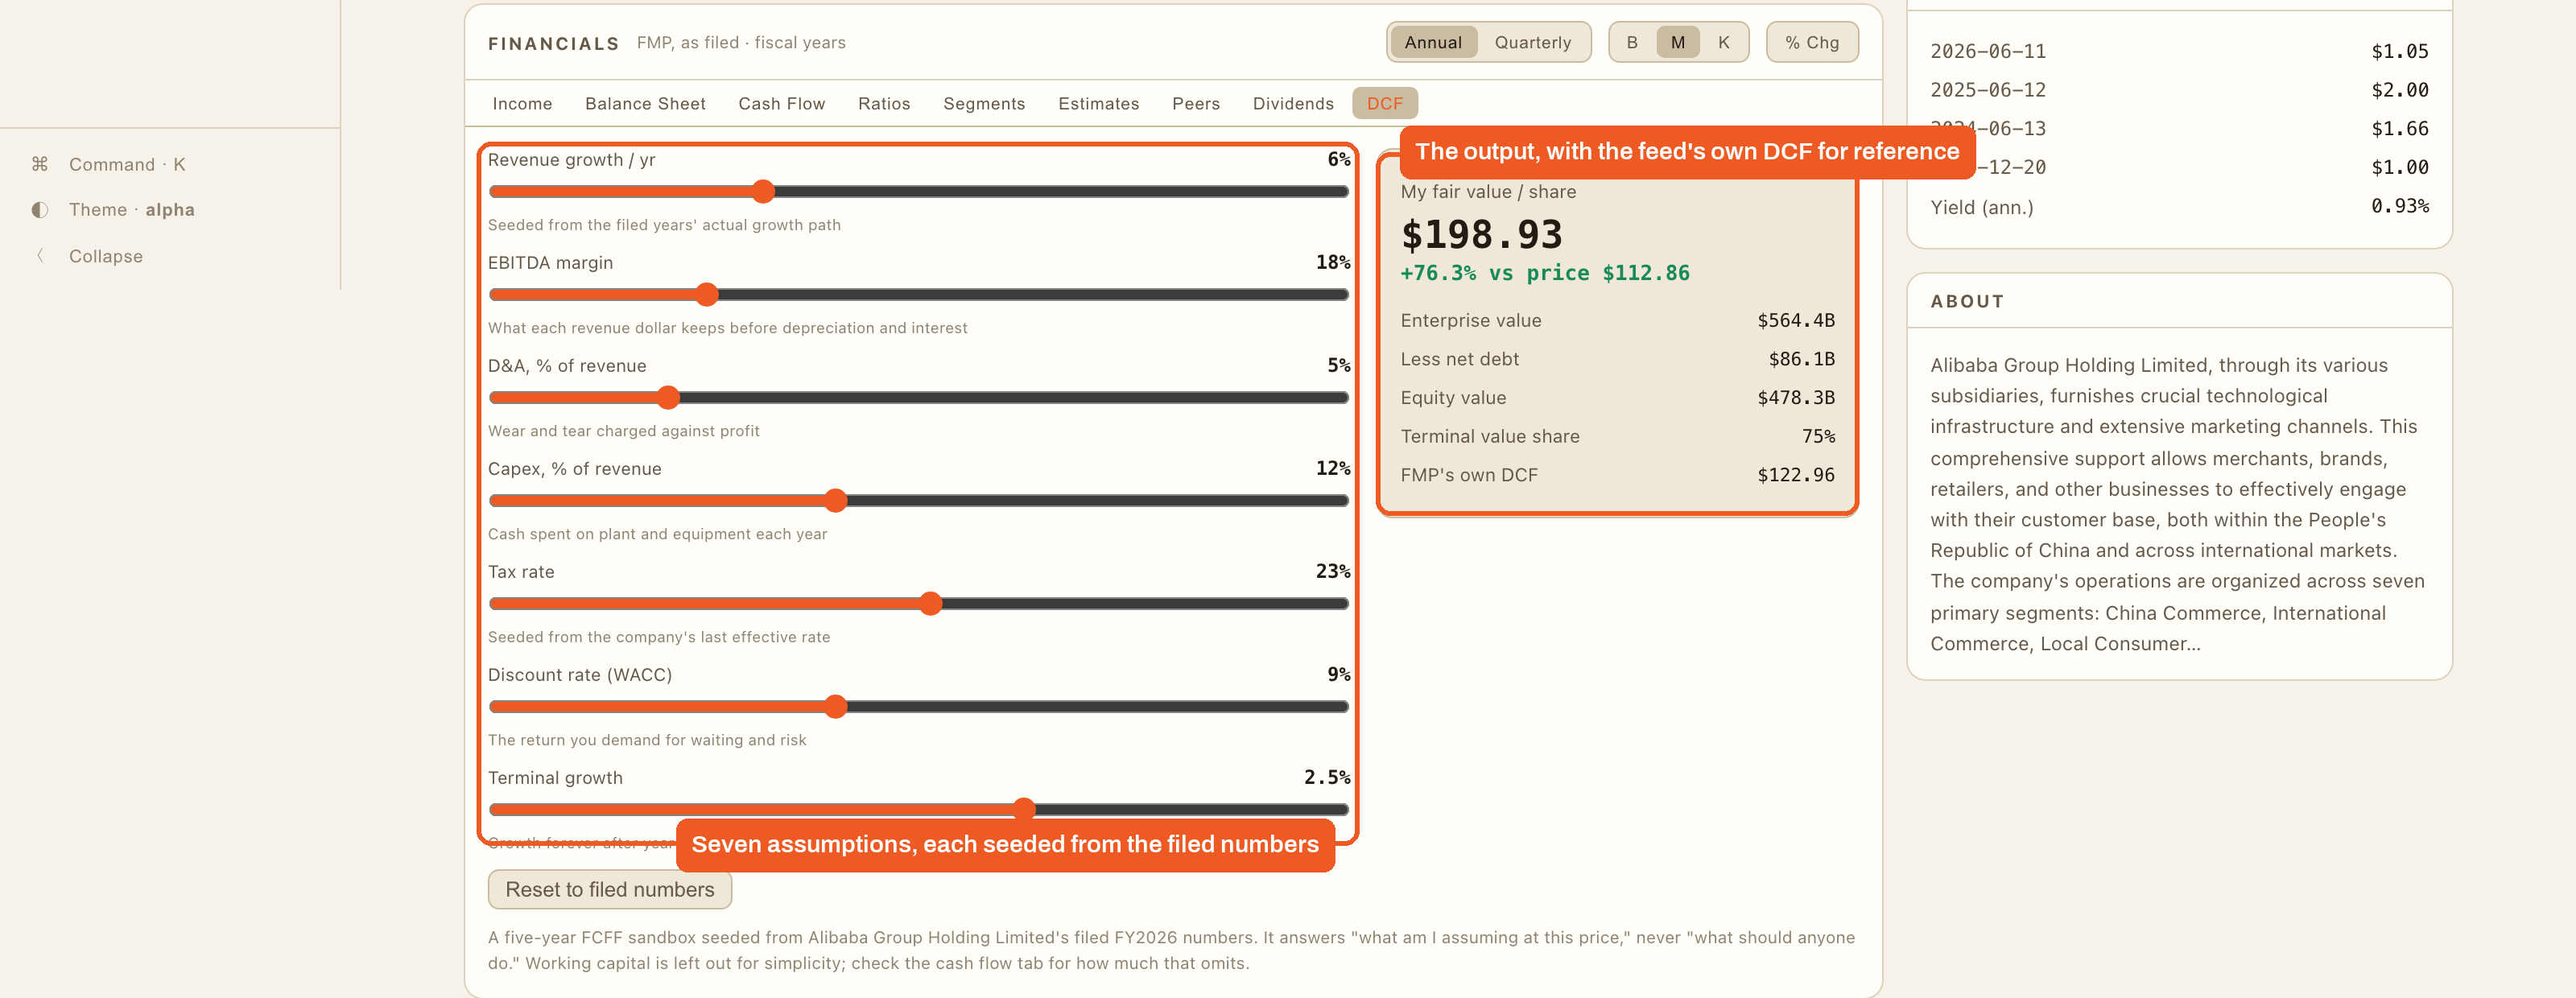
That is one company on the desk, and the page reads the same for any name you type.
How the desk measures risk
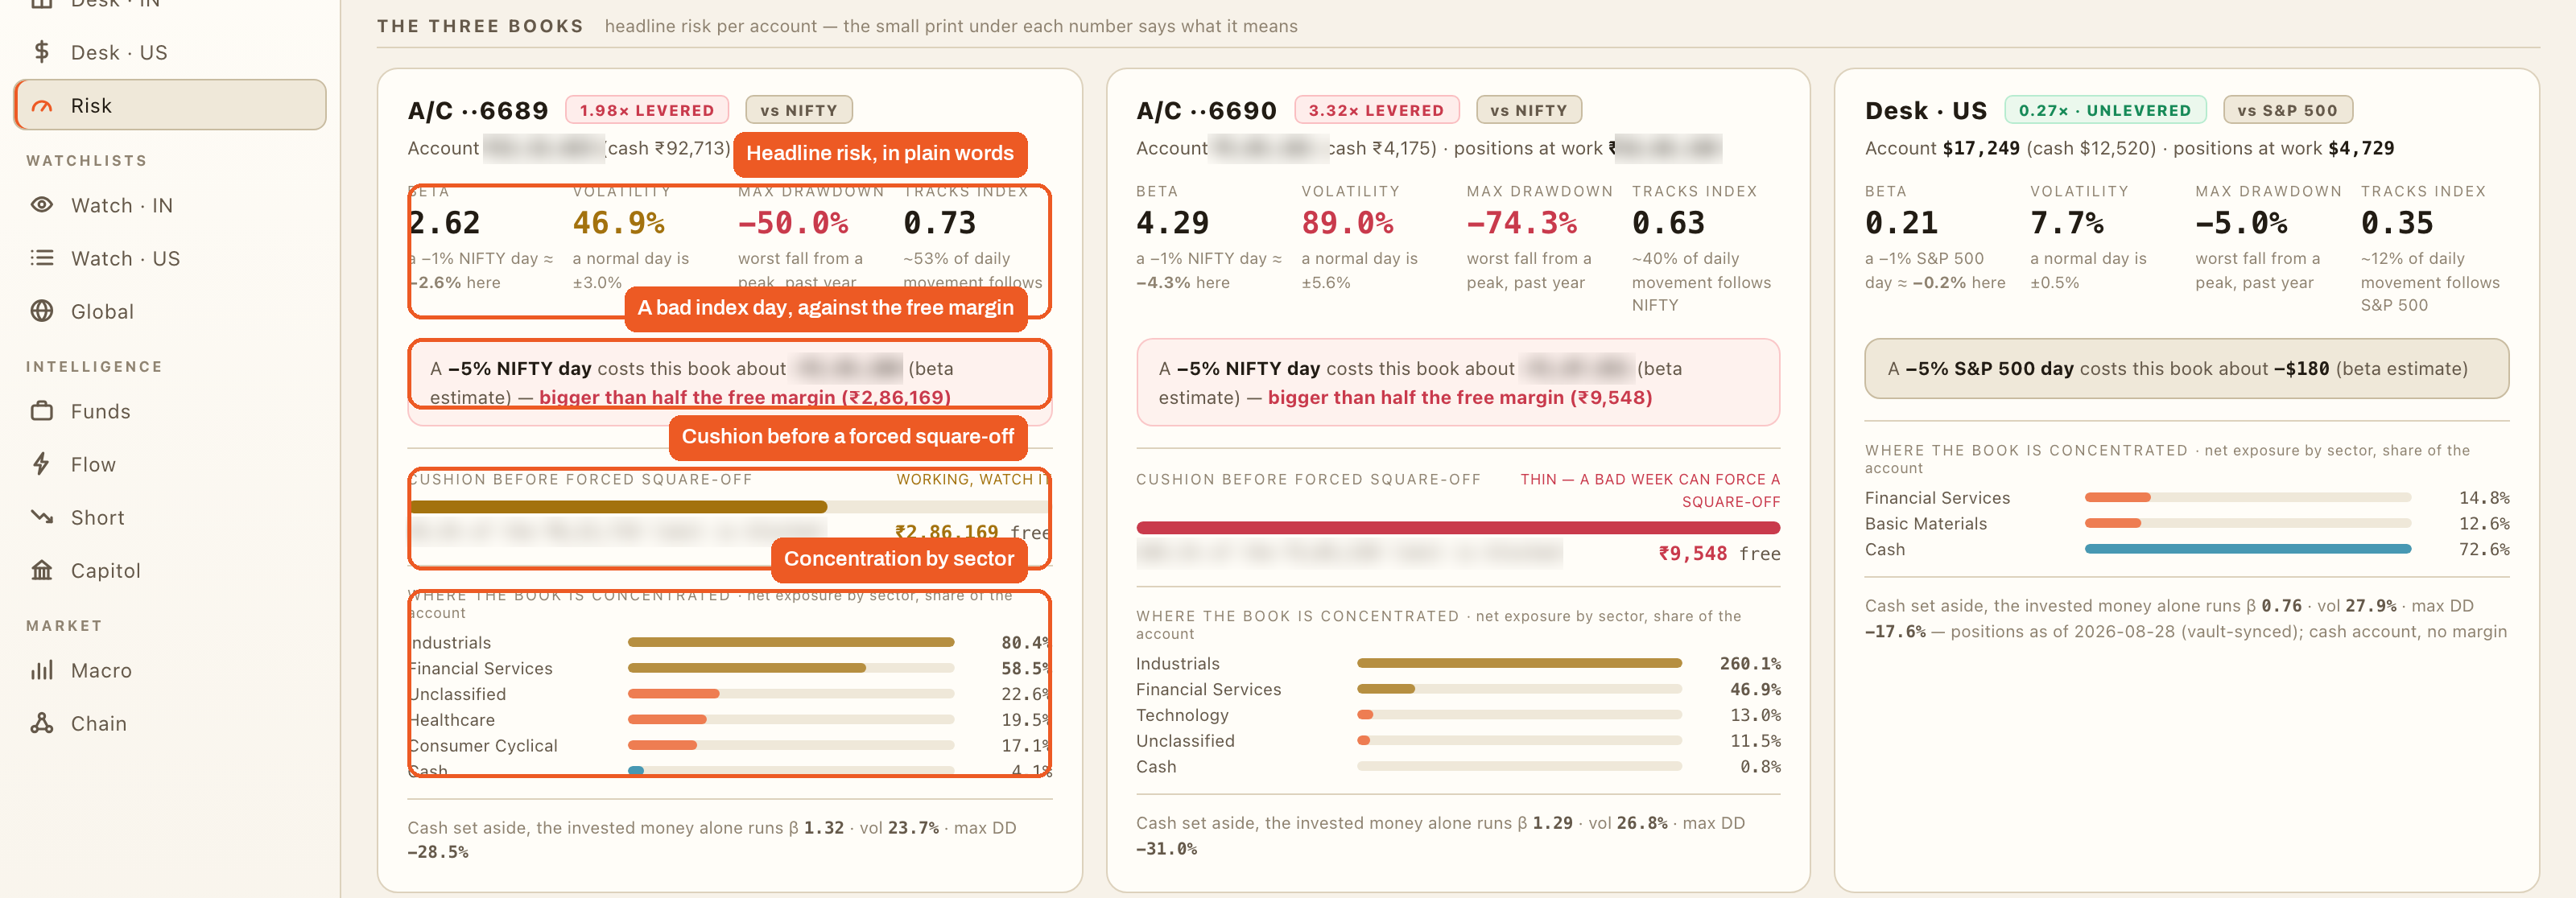
A screen full of live positions is not risk control, because concentration and leverage hide in plain sight on a green day, and I know that because the morning this tab first came up it told me two things I half knew and had never measured. So what I asked the agent for was the panel a risk desk at a fund puts in front of a manager, built for three accounts instead of a fund, reading all three books the way an outsider would, and this is what it built.
One headline card per book
Beta, volatility and the worst fall of the past year, each with a plain line under it saying what the number means on an ordinary day, then what a five percent index day would cost the book next to the free margin, then the cushion before a forced square-off, which is the point where the broker starts closing positions on its own because the margin has run out, and then where the book is concentrated by sector. Futures count at their full underlying value, so a levered book shows positions worth more than the account, and that is the point of showing it that way. The two accounts on the first desk run levered, about two times and three times, and the US book is unlevered and mostly cash, and the cards say so without me doing any arithmetic.
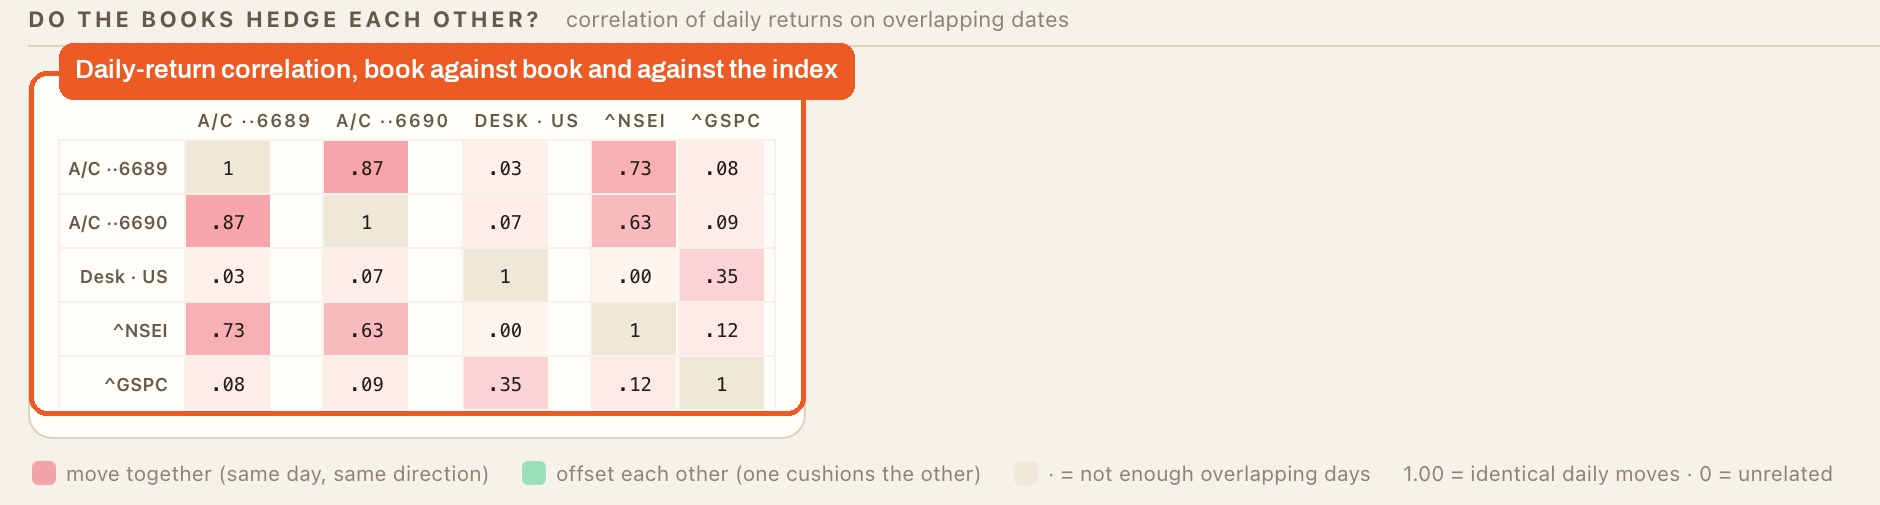
Do the books hedge each other?
A grid of how each book’s daily returns move against the others and against the two indices. Mine mostly do not hedge each other, the two accounts on the first desk move together at 0.87, and the US book is unrelated to both, which is diversification I got without planning it. That was the thing I half knew and had not measured, and now it is a number on a screen every morning.
What is inside each book
One line per position, sorted by size, with the share of the account, which can top a hundred percent with leverage, and the same beta, volatility and worst-fall numbers per name, and under each table a grid of which names move together. The first two lines are always the ones that decide the week, and that is the second thing this tab told me.
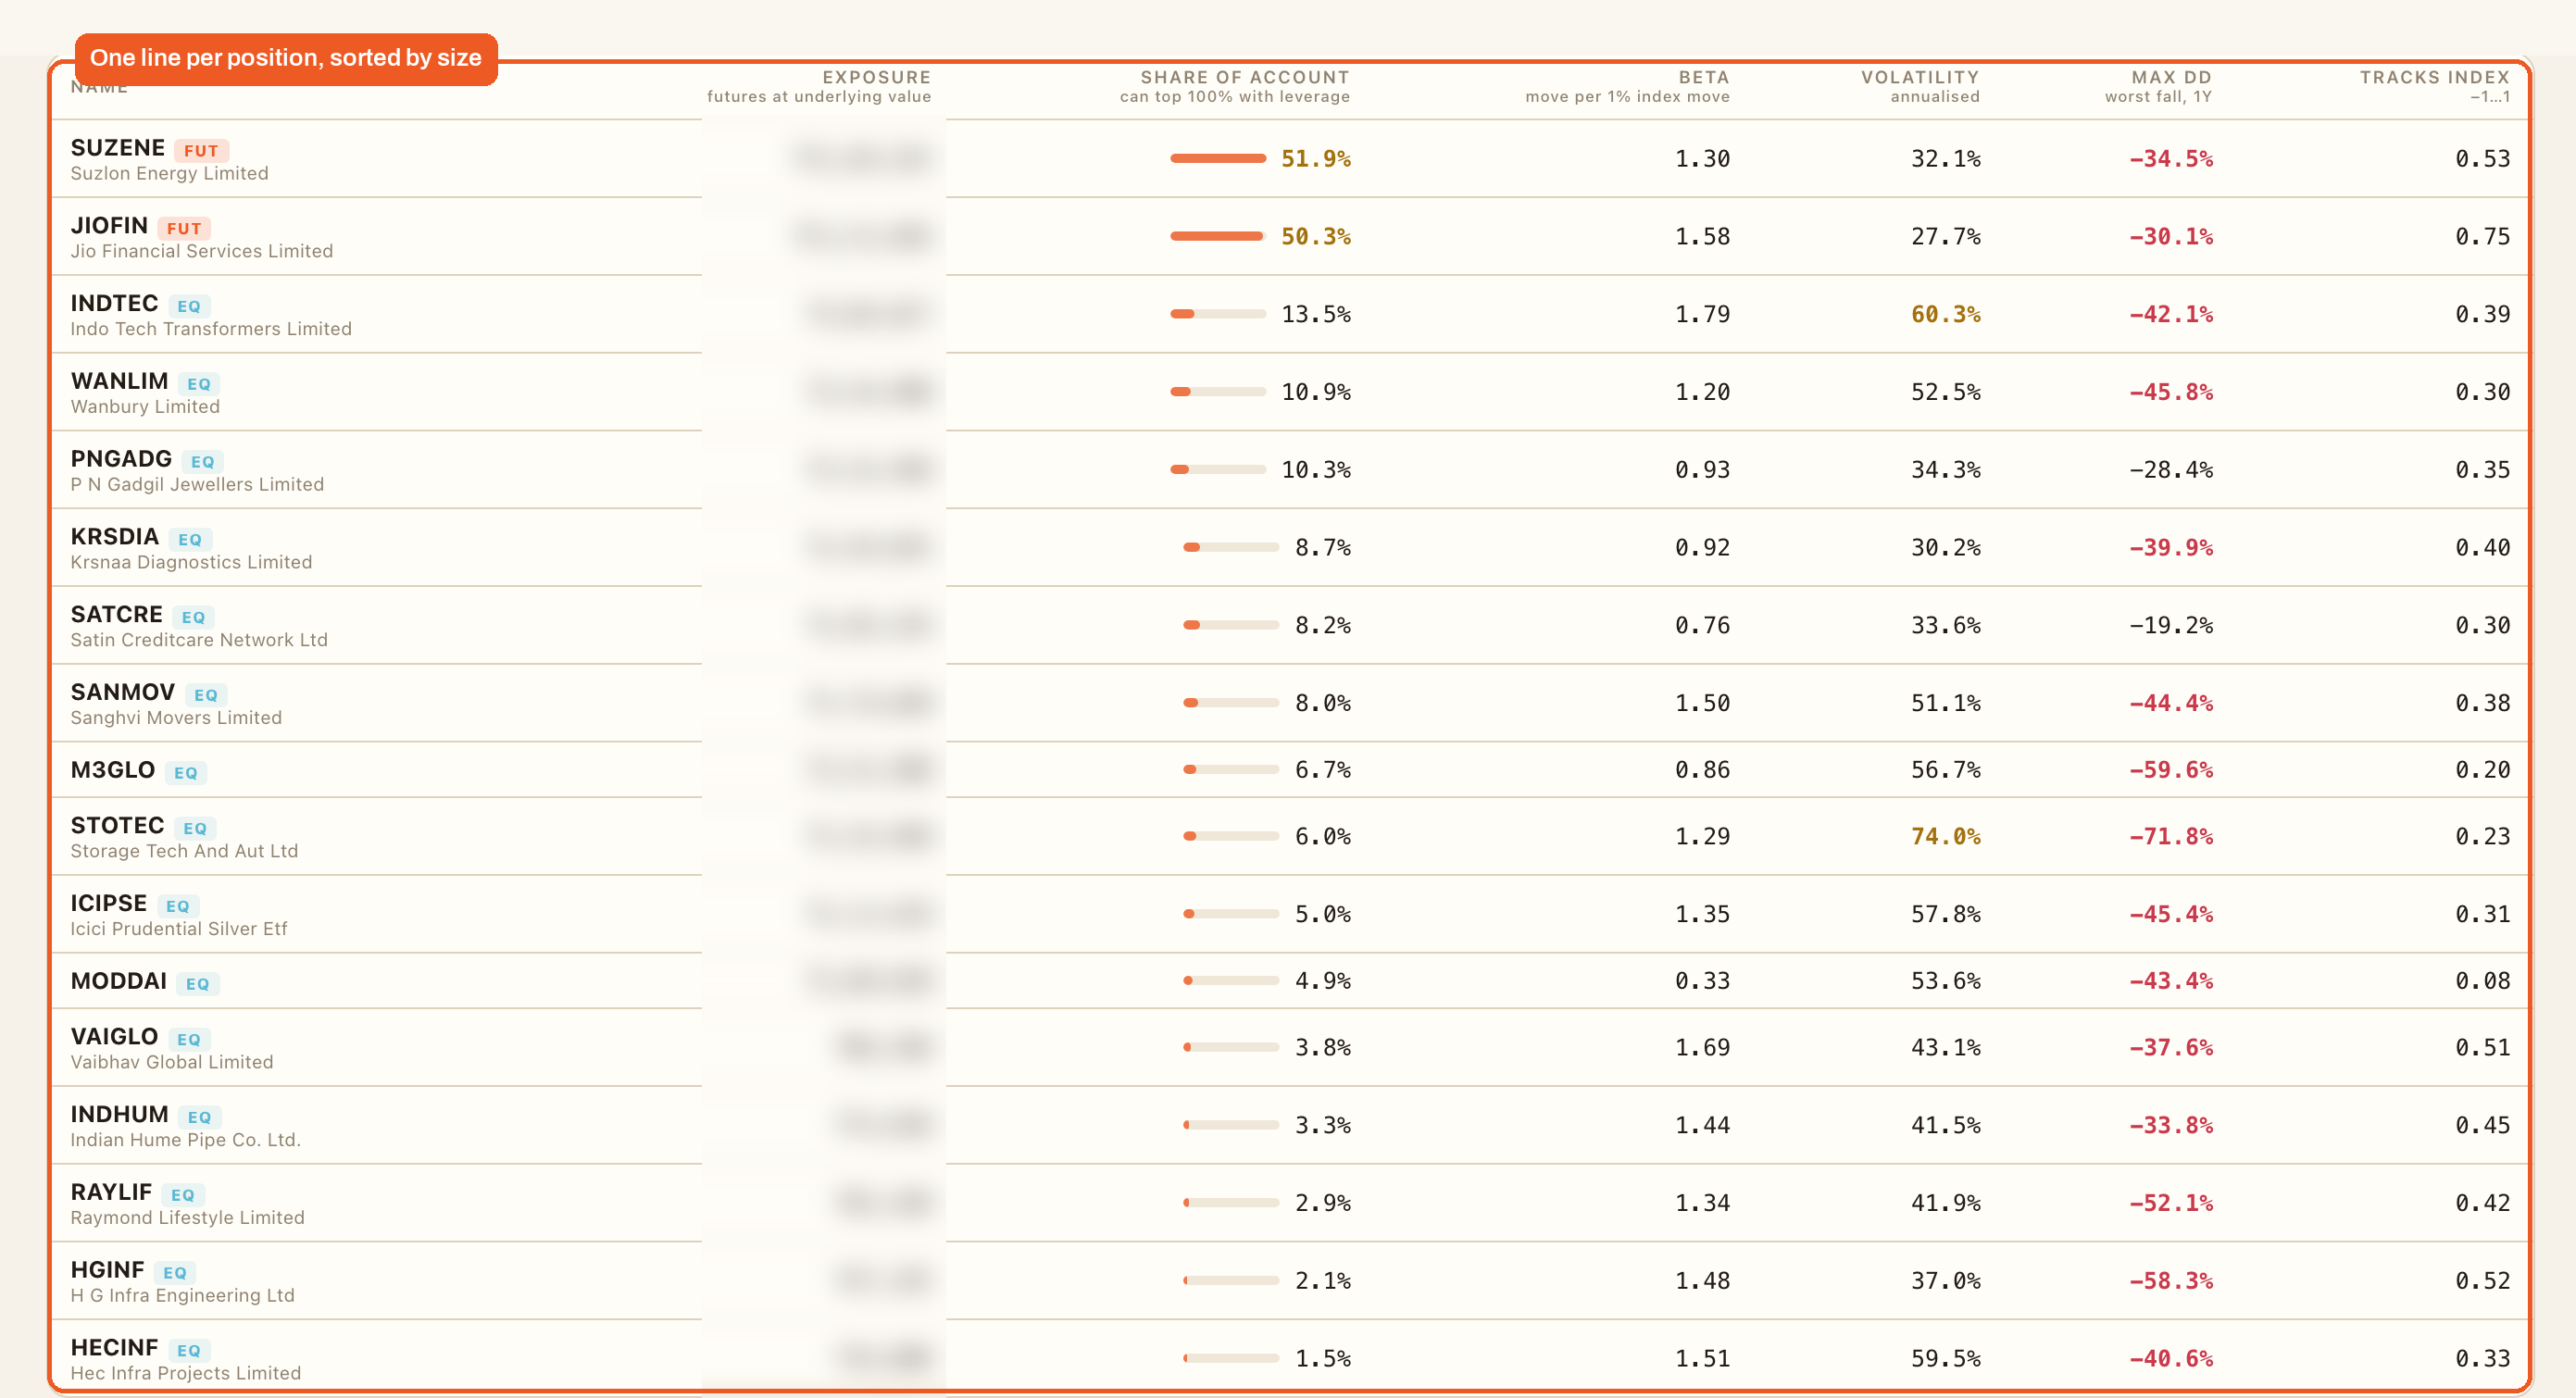
It is the six numbers an outsider would ask for first, on one screen, a long way from a fund’s risk system, and for three books that is enough.
What runs without me
The clock is the part of the desk I want to be careful about, because it is easy to picture more automation than there is, so here is exactly what runs on its own and what waits for me.
The desk’s own loops
The positions refresh every thirty seconds, the options tape on the index every ten minutes, and the heavy tabs, funds, filings, macro, every few hours to a day. None of that needs me, and none of it needs the agent either, it is the desk doing its rounds.
Nine alert rules
Every minute the desk checks nine rules against the data it already holds, and when one fires my Mac gets a notification and the desk gets a line at the bottom, once per rule per day. The rules are a day move on a name I hold or watch, one rule per list, margin used past a line, a futures contract inside a week of expiry, earnings inside three days, a congress filing on a held name, an insider cluster, and an activist filing on a name I own or watch. They are one small text file, and adding a rule is adding a line. They do not decide anything, they tell me where to look.
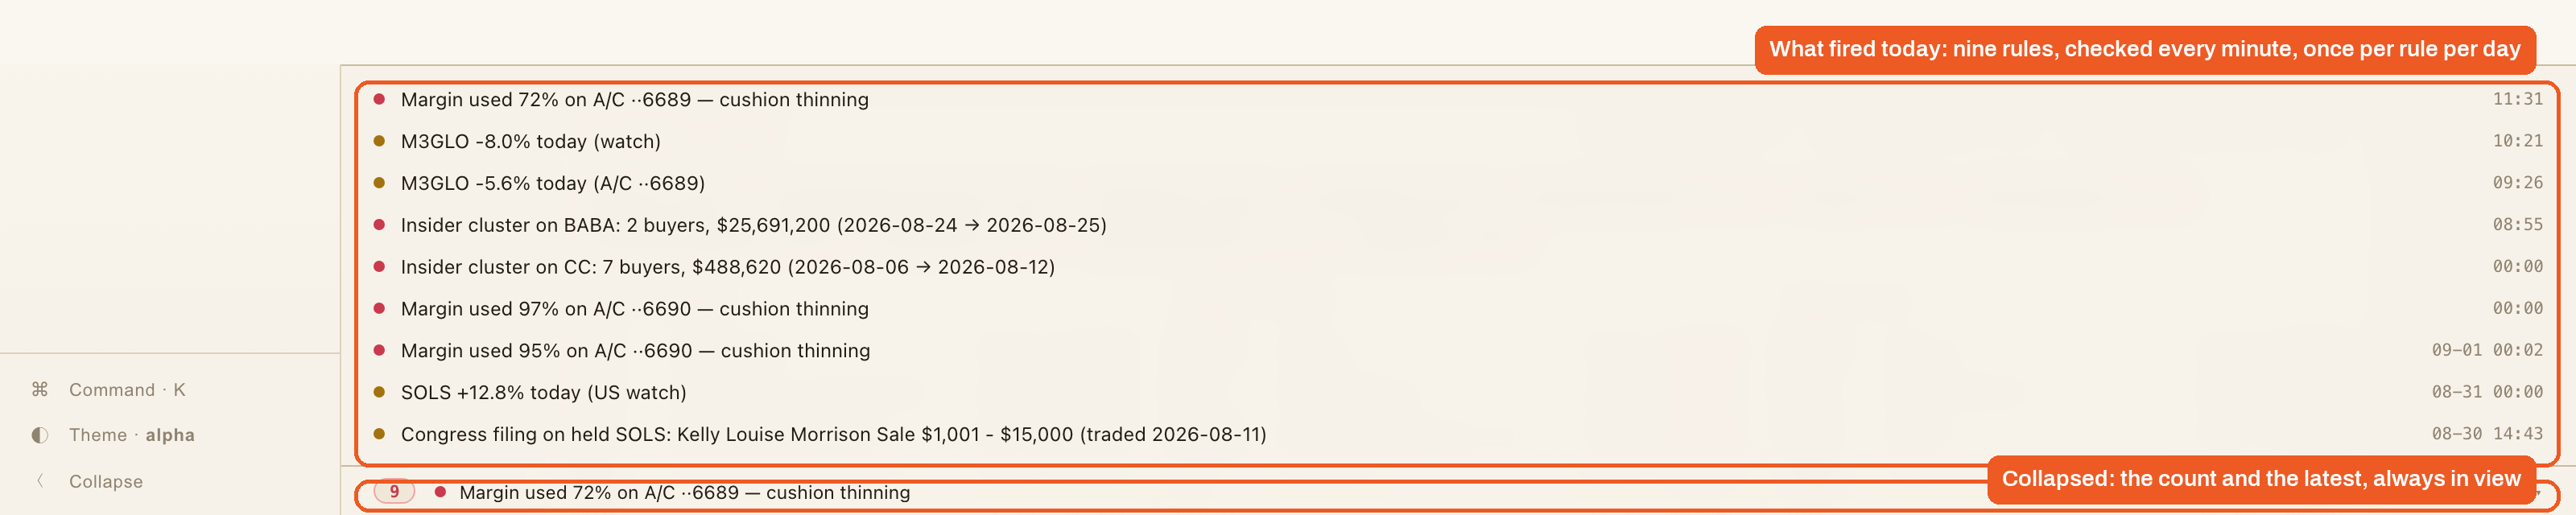
The rituals are skills
Then there are the jobs I fire with one phrase. “Run the watch” is the daily check on the model portfolio, prices, filings, news and the catalysts coming up, written as a dated note. “Run the tape” is the Flow tab as a written report, the same read on the names I own or cover, filed as a note I can come back to, and that is the skill from I Do Not Trade Options. So I Taught Claude Code to Read Them. if you want it in full. “Screen the inbox” sorts what I clipped that day. Each phrase is a skill, and the calendar tell and the selloff triage from the earlier editions sit in the same folder and run the same way. The desk shows, the skills read, and I fire them, because the two rules I run all of this on are that collecting and judging are separate steps, and that every step leaves something I can check that is not the agent’s word, a file on disk, a filing link, a row count.
The always-on option
All of this runs whenever my laptop is on, and for most people that is enough, the desk is up while you work and the alerts land on it. If you are serious about a desk that never sleeps, the whole folder, the vault, the agent and the desk, can live on a VPS, which is a small rented computer in the cloud that is always on. Obsidian syncs to it, the desk runs there around the clock, and Claude Code’s remote control lets you talk to the agent from your phone. I run it that way, and it changes two things, the alerts and the snapshots no longer depend on a lid being open. One more option, and it may matter to you more than to me: connect Telegram to Claude Code, and the ping lands on your phone the moment it fires, wherever you are.
What this desk is built for
A reader quicker than me is going to look at twelve tabs and ask what the catch is, so let me separate two things that look the same and are not, what this setup cannot do, and what I have set mine up not to do, because almost everything on the second list gets called a limitation and it is a choice.
It backtests off the broker’s history
Once the broker’s API is wired, the same connection that prices the desk hands you the price history as well, minute by minute, and that is enough for a backtest, which is running an idea over past prices to see whether it would have worked. I run one sometimes, the last one was an intraday options idea over a hundred sessions of the broker’s own candles, the agent built the test, scored it, and came back with the honest answer that the idea only works when one judgement call is right, which is exactly what a backtest is for, and a factor model or a full risk engine is one more description away if that is how you run money, because the history is already there.
It places orders through the broker
The same API takes orders on almost every broker, Interactive Brokers, Alpaca, Robinhood’s separate account for the agent, Zerodha and the other large brokers, so when a strategy tests well the desk can trade it, the agent sends the order through the broker, sized by the rules you wrote down, and the fill comes back onto the same screen. That is the part most people ask about first, and the answer is yes, if your broker opens that door, and it is the reason the backtest above is worth running at all.
The paid feed is a data provider
The financials block on the ticker page runs on the paid feed, and I want to be plain about what that is, because it is the same arrangement every screener you pay for has, the statements come from a data provider and the tool sells them back to you with a screen around them, and here the provider is the only thing you pay for and the screen is yours. And if you do not connect a broker at all, or connect it only for your positions, the quotes, the history and the charts come free from Yahoo Finance, delayed by about fifteen minutes on most exchanges, and it covers almost every market there is, which is exactly how the Global tab runs today.
What I do with orders
Now, what I actually do, because it is not one answer. For the intraday options trades, the straddles and the scalps, the broker’s own algo platform places the orders, which is the broker’s tool for firing orders by a rule you set, because that is a rules game where the entry and the exit are decided before the session opens and speed matters more than my hand, and I would be the slow part. For the equity book I do not use it, and I do not think I will, because that one moment at the broker, after the desk has put the whole picture in front of me, the size against my rules, the reference price, the cushion, is the part I like doing myself, and the decision has to be mine. So build yours whichever way you trade, and the desk does not care either way. Which agent sits at it does not matter either, and that is next.
Any agent can sit at this desk
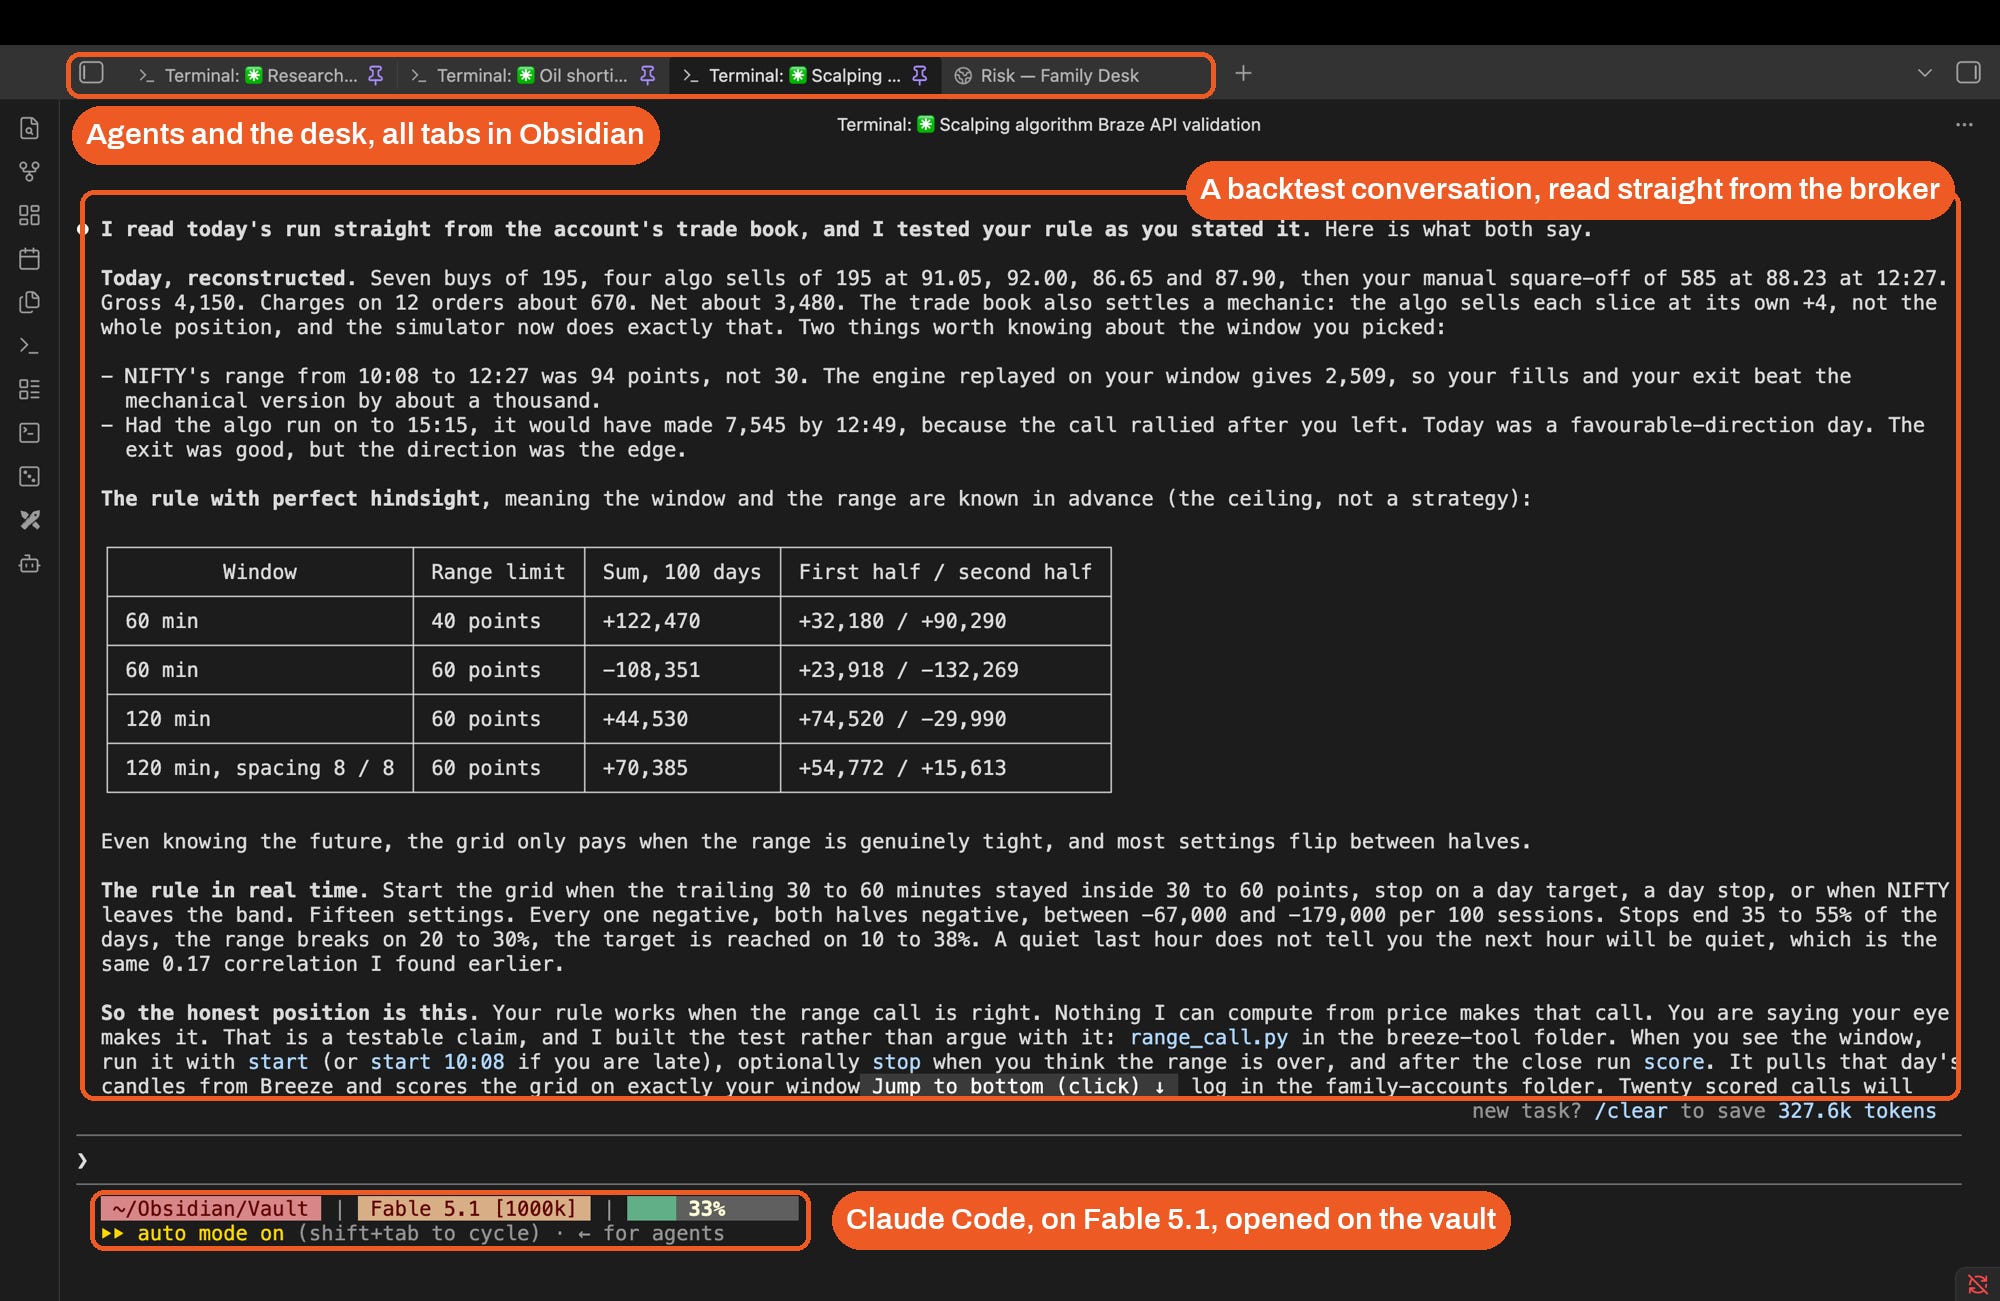
You have the list already from the map at the top, Kimi Code, Grok Build, Codex, the desktop apps, Claudian if you never want to see a terminal, and any of them opens the same folder and gets the same twelve tabs. Claude Code is the main one here, on Claude Fable 5.1, and it runs inside Obsidian in a terminal tab like this.
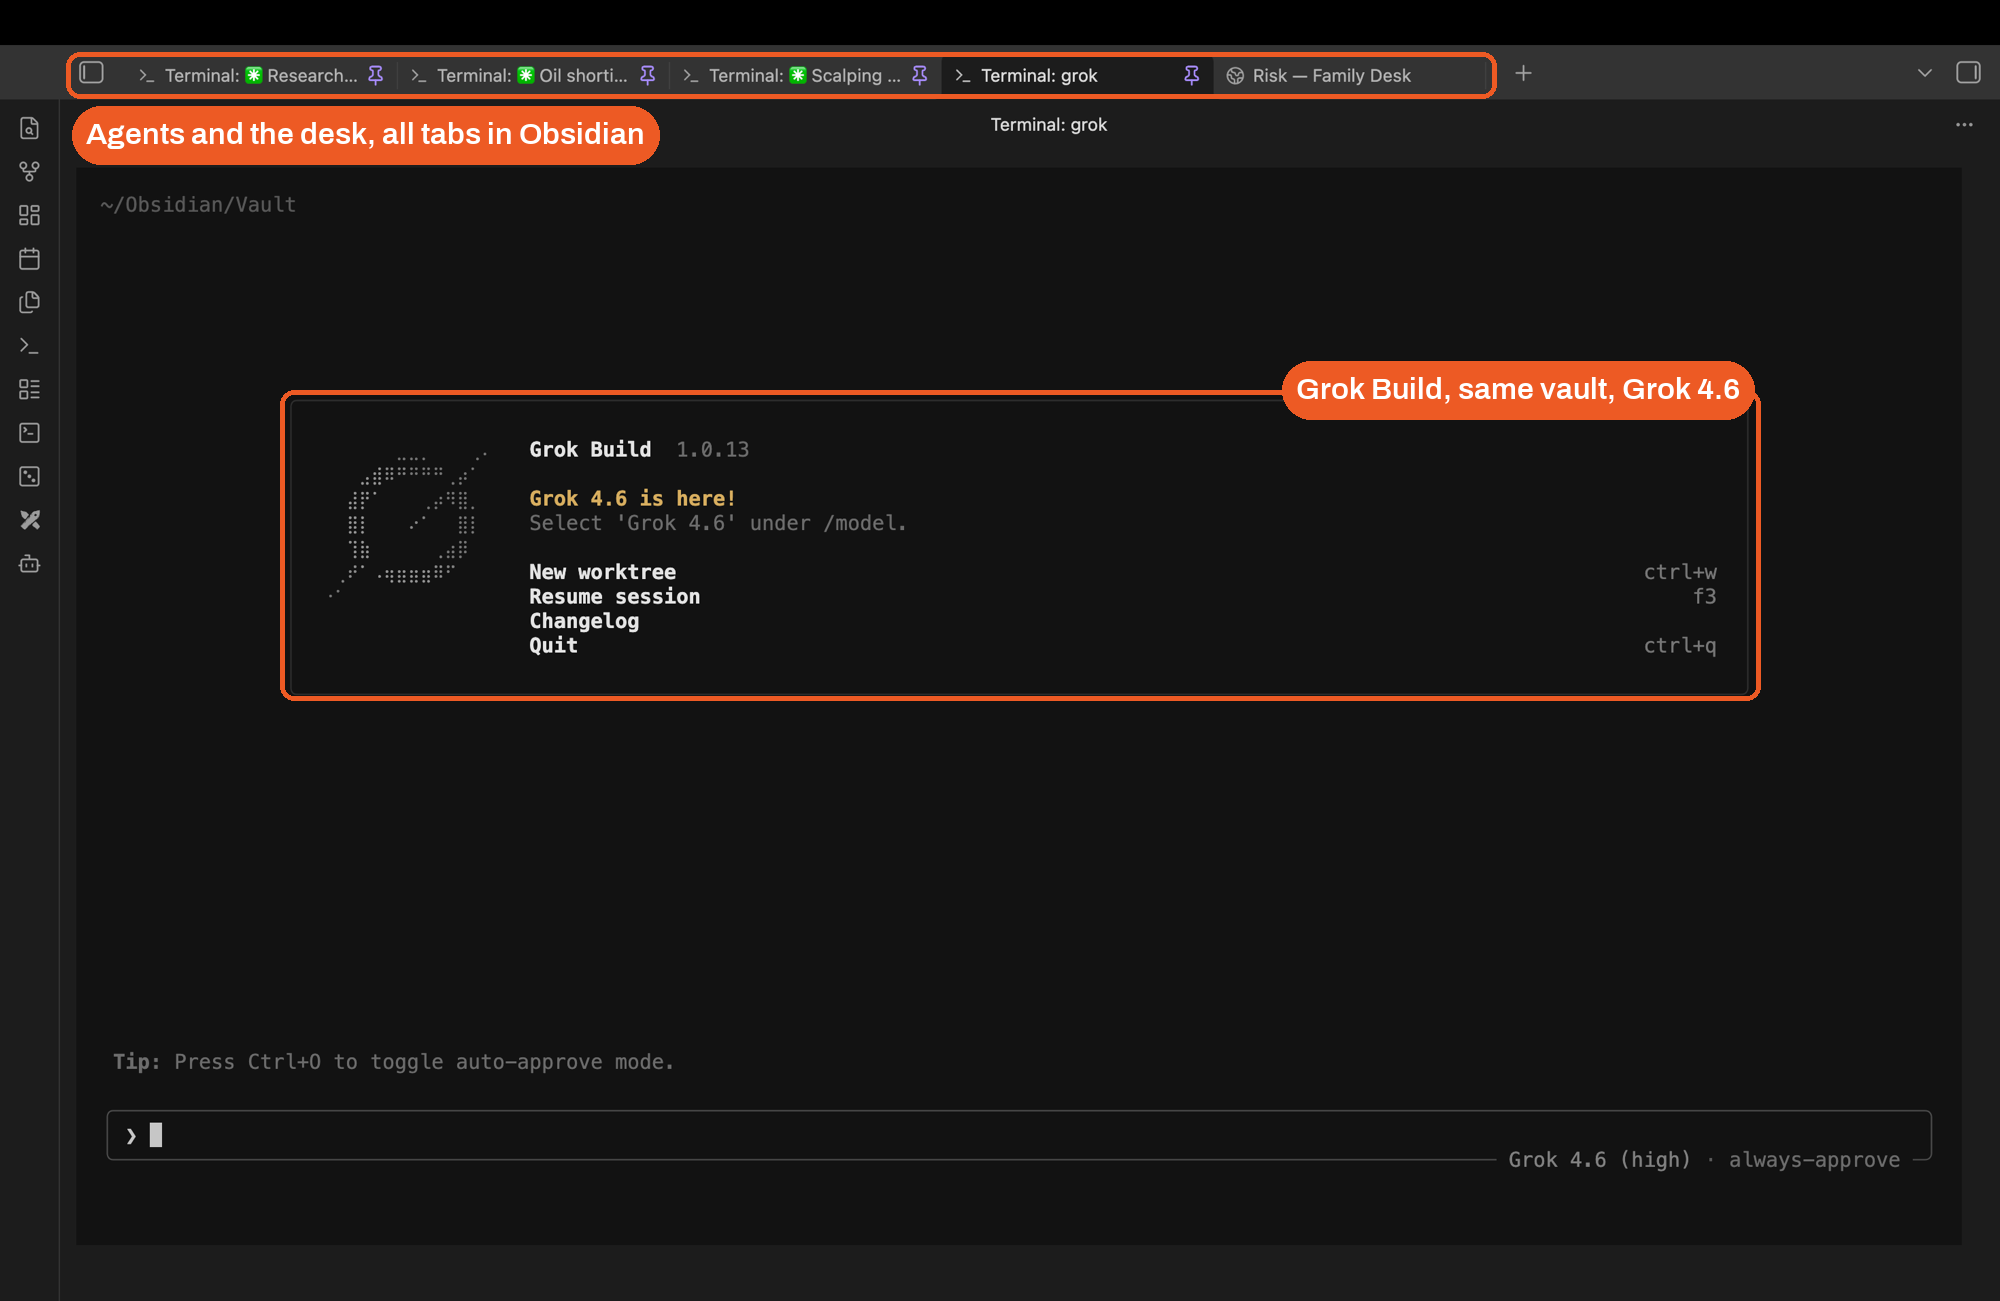
Grok Build sits in the next tab, on Grok 4.6, and I use it most days alongside Claude for one specific reason, which is that Grok reads X live, and X is where most of the seasoned investors I follow actually post, so when I want to know what people are saying about a name that is the agent I ask, and the answer lands in the same vault as everything else. And 4.6 is a very good model on its own, so some days it is simply the one I open first. Two agents, one folder, one rulebook, and whichever company ships a better model next month gets the chair without anything else changing.
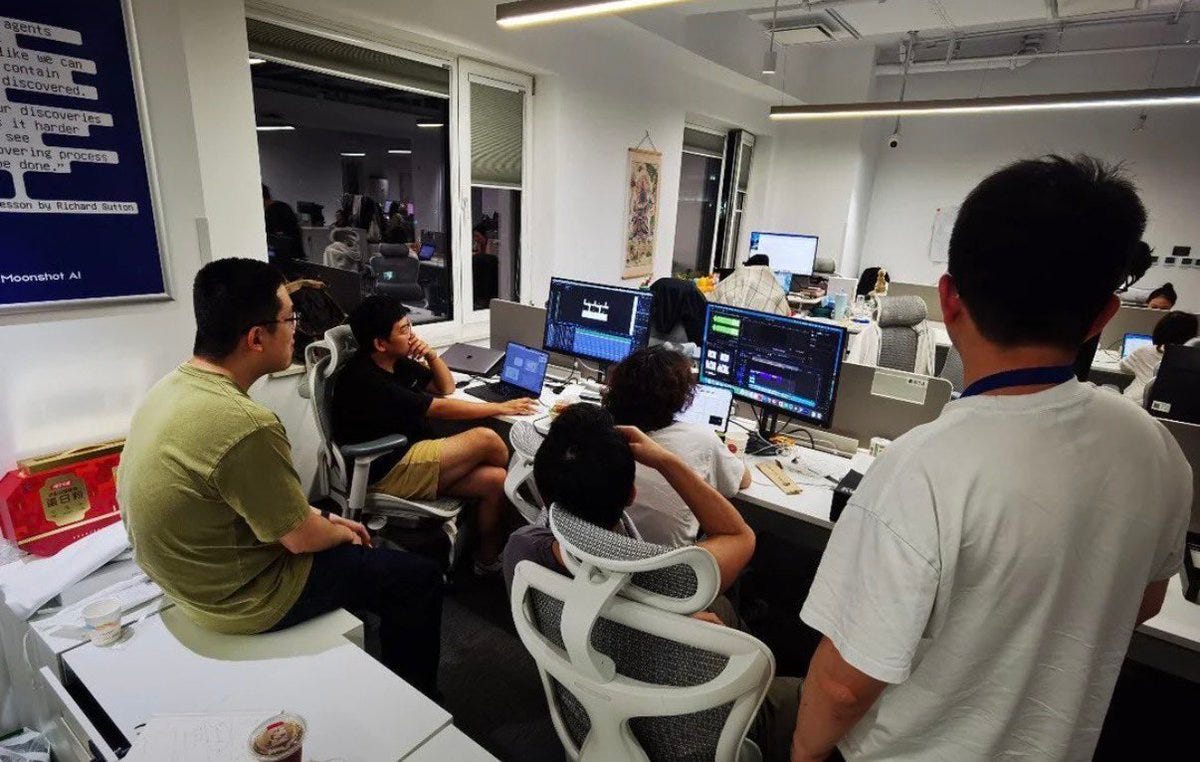
Kimi Code is the third one I run inside Obsidian, and I want to put one photo here rather than a screenshot, because it says more about the company behind it than any benchmark does. This is the office of Moonshot AI, the company that makes Kimi, and what is mind-boggling to me is that this is a team that closed a 2 billion dollar round in May 2026, led by Meituan’s venture arm, at a valuation above 20 billion dollars, and they are sitting in that room, on those chairs, building the model. That is an extremely, extremely good team, and if the Claude subscription is the thing that feels expensive to you, Kimi Code is the one I would try first, because it opens the same folder and reads the same rulebook, and your desk will not know the difference.
If this edition has earned its read so far, tap the ❤️ at the top of this email or page. One tap from you is how Substack decides whether this piece reaches anyone beyond my own subscribers.
How to install the Claude Code build
This is the Claude Code build, the memory, the agent and the plugins, in the order you install them, and it is the part every tab above stands on. The live desk itself, the twelve tabs, is the section after this one, and it stands on everything here. If you want the install in full with every screen, How I Set Up Claude Code as My Investment Research Analyst still holds, with its walkthrough video, and so does the standing rule from that edition: if any step confuses you, copy the confusing part, paste it into the agent, and ask it to walk you through, because you are setting up an analyst and it can do its own tech support.
One: Obsidian and the vault
Download Obsidian from obsidian.md, open it, and create a vault, which is nothing more than choosing a folder on your computer and giving it a name. That folder is the whole build from here on.
Two: the agent
Claude Code installs in two or three steps, and the current ones live on its official quickstart page, so ask Google or any model, how do I install Claude Code, and follow that. Kimi Code, Grok Build and Codex install the same way, one search each. If you would rather never see a terminal, install the Claude desktop app or the Codex app instead and connect it to the vault folder, the notes in Obsidian and the agent in its own window.
Three: the plugins
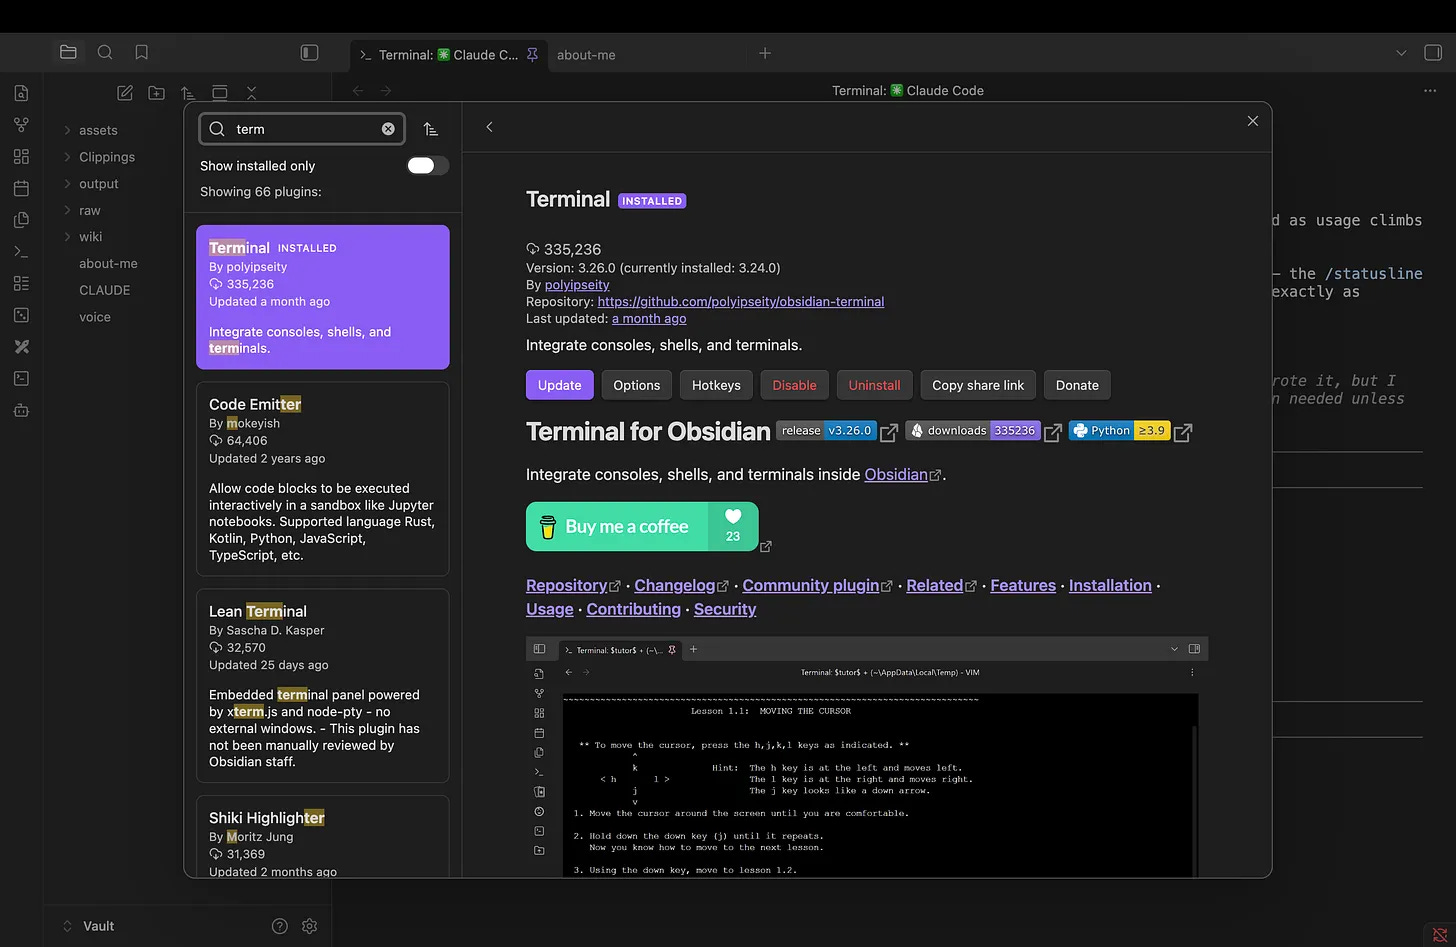
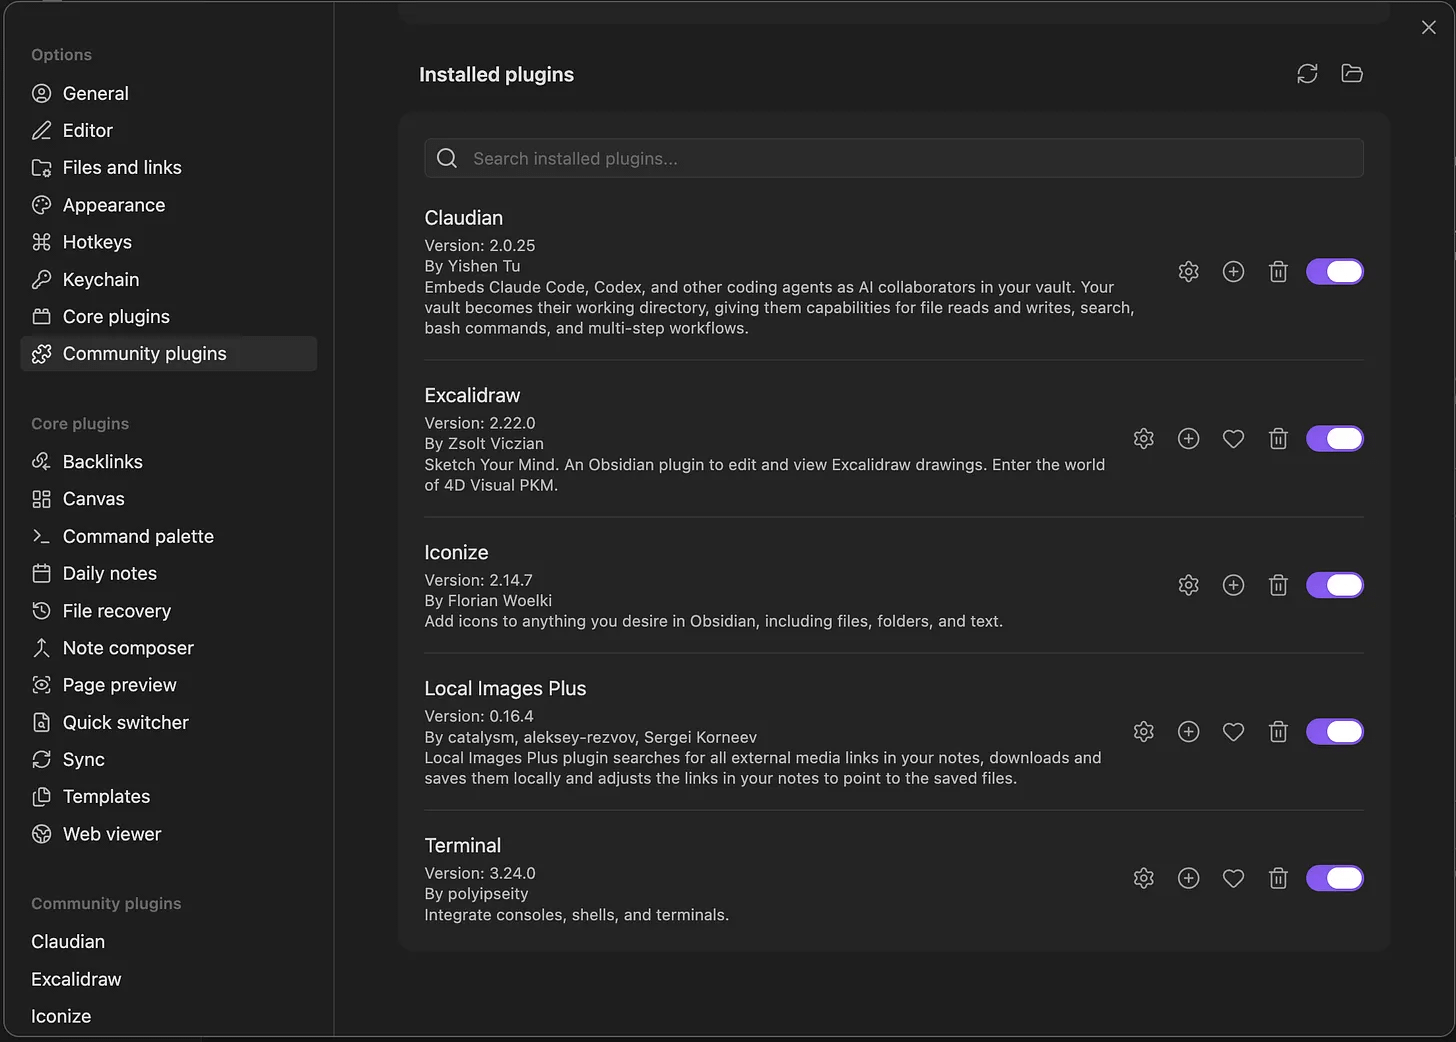
In Obsidian go to Settings, Community plugins, Browse, and install three by name: Terminal, which opens the agent next to your notes, Local Images Plus, which keeps the charts inside anything you clip, and Claudian if you want the agent as a chat window instead of a terminal. Then Settings, Core plugins, and switch on Web Viewer, which is what puts the desk and any web page in an Obsidian tab. In your browser, add Web Clipper from obsidian.md/clipper, open its settings, add your vault, and in the default template set the note location to raw. Playwright, the browser the agent drives, is one sentence typed at the agent later: install Playwright for yourself.
Four: the folders and the rulebook
Open the Terminal tab, type claude, and paste this:
Create this folder structure for my knowledge base:

- raw/ - this is my inbox where I'll dump source material
- wiki/ - this is your domain, you'll write and maintain everything here
  - Create a _master-index.md inside wiki/ with the heading "Knowledge Base Index"
    and a note that says "Topics will be listed here as they are created."
- output/ - this is where query results and reports go

Just create the folders and that one file. Nothing else yet.
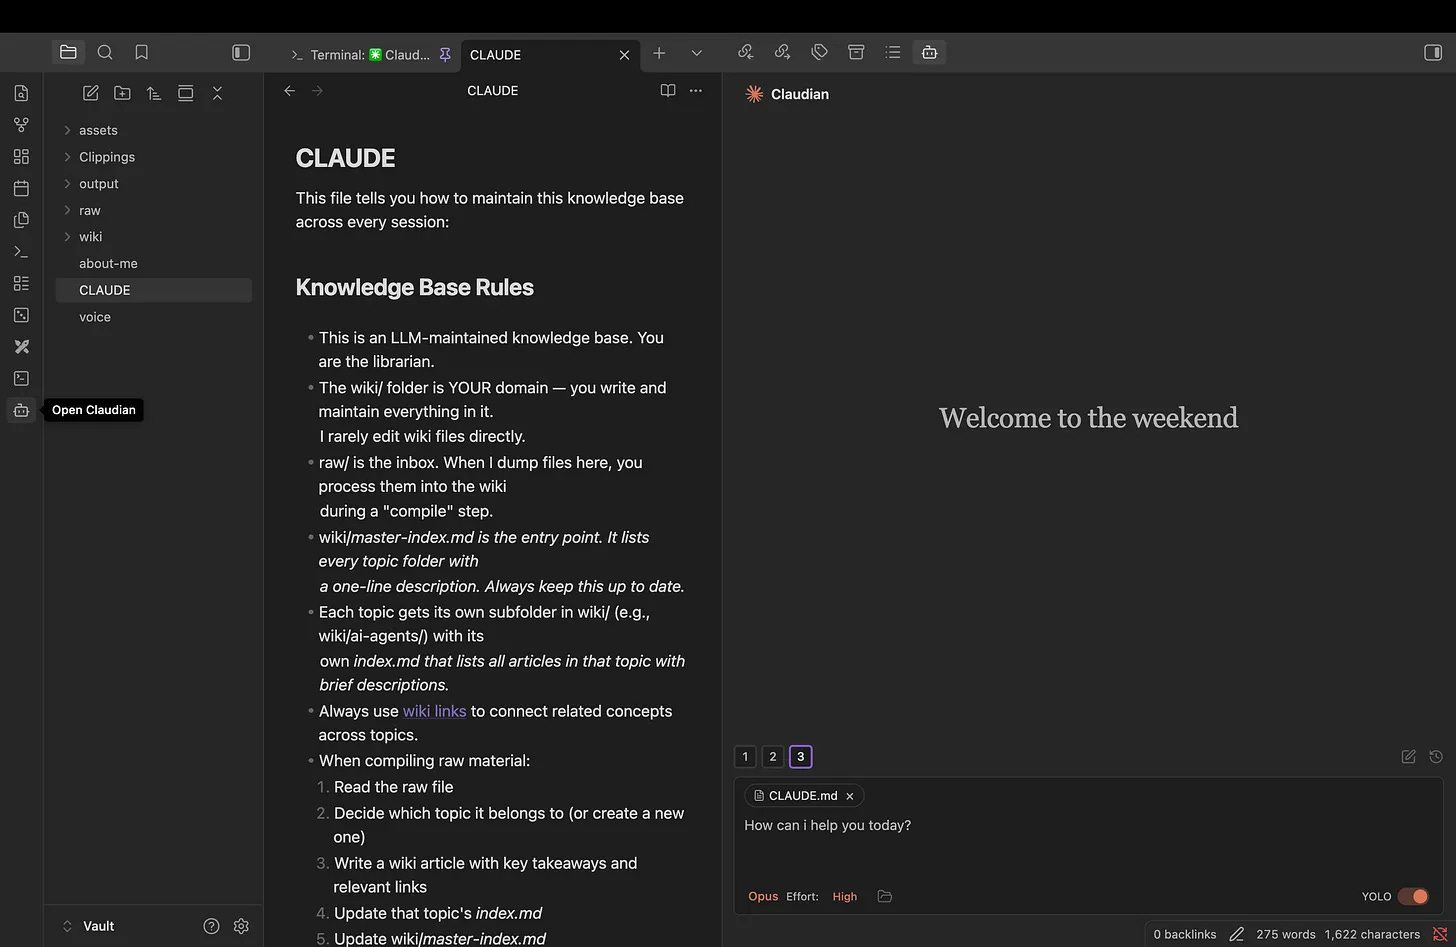
Then create a file at the top of the vault called CLAUDE.md and paste this in. It is the rulebook, the agent reads it at the start of every session, and it is the same one I published in the first edition, because it has not needed to change.
This file tells you how to maintain this knowledge base across every session.

## Knowledge Base Rules

- This is an LLM-maintained knowledge base. You are the librarian.
- The wiki/ folder is YOUR domain - you write and maintain everything in it.
  I rarely edit wiki files directly.
- raw/ is the inbox. When I dump files here, you process them into the wiki
  during a "compile" step.
- wiki/_master-index.md is the entry point. It lists every topic folder with
  a one-line description. Always keep this up to date.
- Each topic gets its own subfolder in wiki/ (e.g., wiki/ai-agents/) with its
  own _index.md that lists all articles in that topic with brief descriptions.
- Always use [[wiki links]] to connect related concepts across topics.
- When compiling raw material:
  1. Read the raw file
  2. Decide which topic it belongs to (or create a new one)
  3. Write a wiki article with key takeaways and relevant links
  4. Update that topic's _index.md
  5. Update wiki/_master-index.md
  6. If a raw file spans multiple topics, create articles in both and cross-link
- Keep articles concise - bullet points over paragraphs.
- Include a ## Key Takeaways section in every wiki article.
- output/ is for query results and generated reports.
- When answering questions, read _master-index.md first to navigate, then
  drill into the relevant topic _index.md, then read specific articles.
- When I ask you to "compile", process everything in raw/ that hasn't been
  compiled yet into the wiki.
- When I ask you to "audit" or "lint", review the wiki for inconsistencies,
  broken links, gaps, and suggest improvements.
If you run a second agent, add a file called agents.md next to it with one line in it, read CLAUDE.md, and every agent you open reads the same rules.
Five: clip, compile, ask
Open any filing or article in your browser, click the Web Clipper, and it lands in raw as a note with its charts. Here is the Web Clipper video, the clipping in motion, the same one from the Obsidian edition, because it is easier to watch once than to read twice.
Then type compile in the terminal and watch the wiki folder fill itself, one topic folder and one index at a time, and that is the memory working. From here the whole thing is three verbs. You clip. You compile. You ask, and when you ask, tell it to save the answer as a note, because every answer that gets saved is a note the next answer can read, and that is the part that compounds. For the first real run, take the prompt from the data section, the S&P Global one, change the company to any name on your own market, send it, and what comes back is your first sourced table.
Six: the first skill, and permissions
When a run comes back the way you want it, tell the agent to remember that job as a skill called analyse, and it writes the job down in a small file under the vault, and from the next time on you type the name and the company. On permissions, the agent asks before it touches a file or runs anything, and I would keep that on for the first week so you can watch what it does, then switch it off and let it work, because the vault is the only folder it can see and Obsidian’s File recovery plugin under Core plugins keeps a copy of every version of every note, which is the undo if anything ever goes wrong.
Three questions a subscriber sent
These came from a subscriber who has been running the setup since the earlier editions, so if you are new, skip this block for now and come back once your vault has something in it.
My research lives in OneNote, with a SharePoint folder per company. How do I move it into Obsidian? This is the hardest step in the whole piece, honestly, and I am not going to pretend otherwise. OneNote does not hand you a notebook as plain text, it exports a section at a time as a PDF or a Word file, so a few thousand notes is a slog of an afternoon, or two, and SharePoint is easier only because it is already files, you copy each company’s folder as it is. So what I would do is not move everything at once. Move the ten companies you are actually working on, into raw under each company’s name, type compile, and let the agent read the PDFs and the documents the way it reads a clipping and write each company into the wiki, and then move the next ten when you need them. And the reason to go through it at all is what you get at the end, which is that every one of those notes becomes plain text the agent can read, so when you ask it about a company it has years of your own thinking on that company in front of it, all of it, and no tool you pay for can give you that.
Should each stock get its own raw, wiki and output, or one of each? One of each, and the company lives one level down. raw is an inbox, it is meant to be emptied, so nothing in it needs a company folder for long. The wiki gets one folder per company, and that is where the stock-level view lives, the filing notes, the concall notes, the thesis. output gets one folder per company too, with a quarter folder inside it for the reports. That is exactly how mine runs, and three inboxes per stock would give the agent thirty maps to read instead of one.
The graph view is full of _index and company_overview dots. How do I make it show relations? The graph draws one dot per note and one line per link, so it can only show the links that exist, and right now the index notes link to everything, which is why they crowd the picture. Two fixes. In the search box on the graph, type a minus sign and the name of the note you want hidden, so -file:_index for the index notes, and they are gone. Then tell the rulebook what a link is for: add one line saying every company note links to its sector, its peers and the filings it came from, and from the next compile the graph draws the relations you care about, because the agent only draws the links you told it to.
That is the Claude Code build, and every reader of the earlier editions already has it. The desk on top of it is next.
How the desk was actually built
The honest answer to how this got built is that most of it was built once already, in a different place, and I should tell you that story first, because otherwise the speed of it makes no sense. Last year I built GreekSoup, which was a research dashboard of my own, and at the time I was planning to launch it commercially later on, because that was the mood everyone was in, right, AI is going to kill the whole software industry and anyone with a framework and a weekend can ship a product, and I had a framework. A few things were on my mind, though. I am an investor first and a builder of experiments second, and once you launch an app you are doing the marketing and the product and the support and the pricing, and all of that would have turned my life into something I did not want it to be, and that was one of the reasons I dropped the idea, kept the software for my own work, and moved on. I did not write the code of it myself, but every feature in it came out of my own research framework, the way I read a company, the ratios I look at first, the peer table, the valuation sandbox, so many of those things were mine already, and when this desk started, what I actually did was go back into GreekSoup, take a screenshot of a feature I had already designed once, hand it to the agent and say I want this here, and it came back in minutes, because a picture of a thing you have already thought through is the best spec there is. That is where the charts, the statements, the ratio groups, the peers and the DCF came from, and the whole desk is yours to download at the end of this piece.
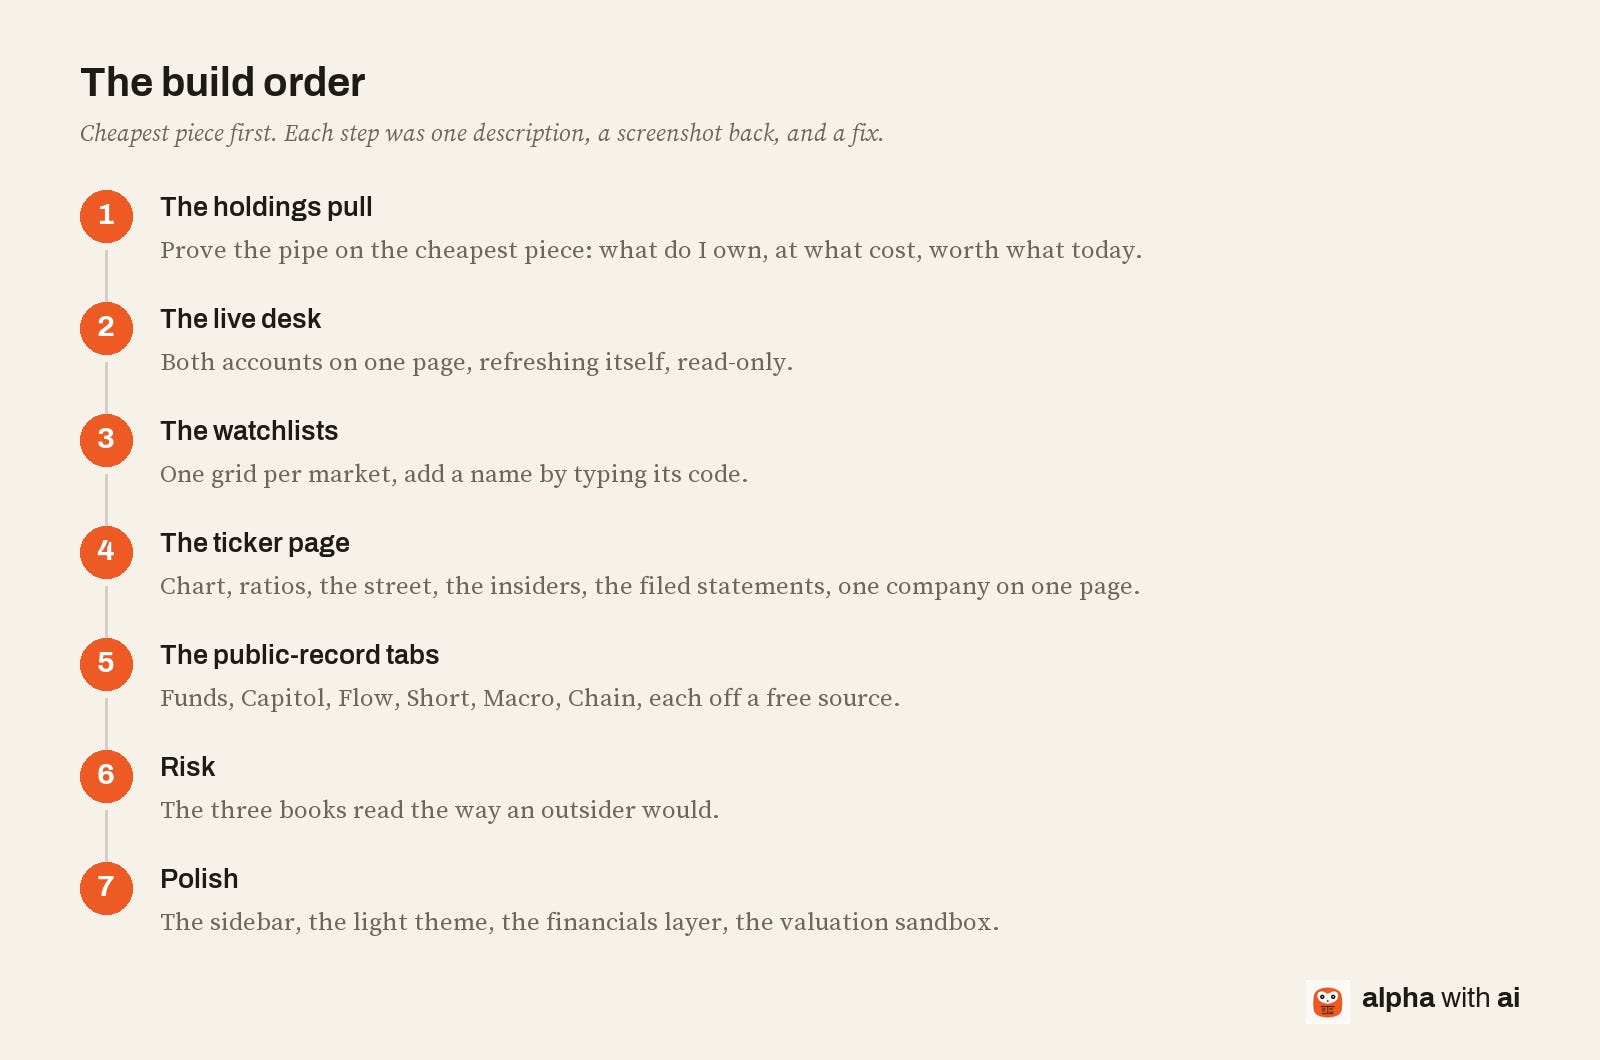
The desk itself started from one page in the vault. The note said what to build against the broker’s API, and it had one rule in it, prove the connection on the cheapest piece first, the holdings, and the agent read that note and had both accounts on one page before I went to bed, which I did not expect. From there it was a loop that never really stopped, where I sent a screenshot in, a screen came back, I said what was wrong with it, and it went again.
If you are starting from nothing
If you do not have software of your own to carry across, and most people will not, start with the apps and the websites you already like. Say you use Koyfin, or Finviz, or Trading Economics, or your broker’s own terminal, and on each one there is a feature you would miss. Go there, take a screenshot of it, paste it into the agent and say I need something similar here, and it comes back in a few minutes, and then you do the next one. Five or six of those on one screen and you will start having opinions about what is missing, and that is when it becomes yours. And the simplest version of all is this piece. Clip the whole article into your vault with the Web Clipper, open the agent on it and say build me this for my broker, my market and my names, and then screenshot the things you want changed.
Give it the keys
The second thing is the keys, and this one is simple. You give it your broker’s API key, and the feed’s key if you take one, and before it builds anything you tell it to find out what each key can do, because you do not know, and it can check in a minute. Mine went through everything the feed can be asked for on its own and came back with a note on which of it my plan allowed and which was gated, and wherever the feed was gated it went to the free record instead, EDGAR for the fund filings and the activist filings, CBOE for the options chains, FINRA for the short data, and the broker’s own history for everything on the first desk. It can reach a lot more than you think, and you only find out what it can reach by using it, which is why I would use it for your research for a few months first and ask for the desk after, because by then you know what to ask for.
Ask for the premium version
The third thing is the look, and it matters more than it sounds, because a screen you enjoy looking at is a screen you actually use. Tell it to act as the designer of a premium terminal, or as a visualisation specialist, the kind a fund pays a lot of money for, and to build to that standard, a premium dark dashboard if that is your taste, and mine came back with the sidebar, two themes, a dark one and the light one you see here, and the search box that jumps to any ticker from one ask like that. From there it is screenshots the other way, every screen sent back with what was wrong on it, and some of it came back wrong, because for a day the desk read one account’s margin as far safer than it was, it was reading the wrong line in the broker’s reply, and I only caught it because the broker’s own page sat next to it and the two did not match. A screen that is confidently wrong is worse than no screen, so the desk still sits next to the broker’s page, and I still look at both.
What runs it, in one paragraph
One small program runs the whole thing. The agent wrote it in Python, which is the language it is most fluent in, there is nothing else to install and nothing to host, so there is nothing to pay for beyond the feed if you take one. The lists you saw, the watchlists, the funds, the members, the chain, are small text files you can open and edit. Everything it fetches once, it keeps, so the heavy tabs open instantly the second time. The agent wrote every line of it, and I have not written one.
Your first tab
So if you want yours, you will not start with twelve tabs. You will start with the one screen you look at first thing every morning, you will screenshot the thing you want it to look like and hand it over, it will come back wrong in two or three places, you will say what is wrong, and it will fix it, and the second tab is one more screenshot, and by the end of the week it adds up to the desk you had in mind. What is left is what all of this costs.
What the whole desk costs
Go back to the tab stack at the top of this piece for a second and add up what yours costs a month, because the number is bigger than you think. This desk runs on Obsidian, which is free, five plugins, which are free, one agent subscription, which you are paying for already if you use any of this, the broker’s API, which most of the brokers I named give their own clients for nothing, and the public record, which has always been free. The one thing on the list with a price is the feed, and it is optional, about 29 dollars a month, or 19 if you pay for the year. So the honest cost of a small Bloomberg for one desk is one feed you can skip, and the time it takes to describe what you want.
The whole desk, without my positions, is at the link below, on GitHub, which is the public site where code lives and anyone can download it, one account wired, the broker connection written for mine and adaptable to yours, and if you like it the way it is you can start from there and change what you want.
If you want to see how the older versions of this setup looked: How I Set Up Claude Code as My Investment Research Analyst was the first install, How I Set Up Claude Code as My Investment Research Analyst 2.0 was the rebuild inside Obsidian, and Claude Code for Investment Research (Part 4): The Obsidian Layer That Makes Everything Compound is the clipping and the memory in full.
The video walkthrough goes out over the next couple of weeks, and if you want it, and the next build after it, make sure you are subscribed. And if you build yours, or take this one somewhere I have not thought of, tell me in the comments, because the best setups I have seen came from readers who did exactly that with the last edition.
The whole desk turned out to be a folder on my Mac and a few sentences about what I wanted to see, and the sentences are the only part of it you cannot download from the link above.
*Disclaimer: Alpha with AI covers US-listed and other global securities for educational and research purposes only. Nothing here is investment, legal, or tax advice. The workflow and its outputs read public filings, investor calendars, and news sources; outputs can contain errors and are observations of past filings, not predictions or recommendations. AI tools, including Claude Code, were used in the research and drafting of this edition. Always verify against primary sources and consult a qualified professional before making investment decisions.*
Written by Shubham Borkar
Financial Clarity. Insightful Ideas.
Excellent. Keep it up